Transform Data Interviews with Count’s Canvas
Technical interviews in data can be a bit hit or miss. But as Count advocate Emily explains with the right tool they can become something brilliant.

Over the last 3 years I've spent working as a technical consultant, I've been asked to recruit data professionals with varying skillsets (e.g. data analytics, business intelligence engineering, data engineering, etc.) into my organization. In the past, this process has always been less than ideal as it's been hard to assess all the soft and technical skills a candidate needs to succeed in a data-driven organization.
Thankfully, I’ve finally found the tool that can help bridge these challenges - Count’s data canvas.
Technical interviews are challenging
If you've ever been interviewed for a technical job, or been the person on the other side running an interview, you've probably experienced a relatively awkward and unsatisfactory process.
Given the stakes are high, this isn’t surprising. The interviewer has a short amount of time to assess a candidate's abilities and make sure they would be a great team fit. On the other hand, the interviewee is trying their best to showcase their achievements and skills while simultaneously evaluating the team and culture fit.
Today, many interview processes evaluate a candidate on their soft and technical skills, which leads to at least one behavioral interview and one or more technical interviews. A behavioral interview assesses candidates through qualitative questions like "Walk me through [...] project" and "Walk me through a situation when...". A technical interview assesses candidates on their theoretical knowledge and hands-on technical skills, even going so far as to ask "sandbox" questions that allow them to provide a deep dive into their code blocks.
But here’s the challenge. The true value of a candidate comes from the combination of their technical knowledge, personality, and experience and yet we test each of these areas separately and never get to see the sum of their parts.
One of the problems is that the technical interview tools often used today are too narrow. For example, for data engineers, they focus on areas, such as LeetCode for data structures and algorithms, or SQL proficiency tests. Each of these areas are important, but examining them one by one is like using a microscope to judge the quality of an artist’s painting.
This is why I was so excited to find Count’s data canvas or “whiteboard”. Finally, there’s now an environment where data teams have the opportunity to work with candidates to examine their technical experience, workflow, and communication style in a more holistic manner.
The canvas allows them to:
- Showcase their skills across the end-to-end analytics process
- Collaborate in real-time with their prospective colleagues
- Work in an iterative, world-class coding environment
Let’s go ahead and dive into the features:
End to-End Analytics Process
As you know, implementing an analytics project involves far more than building charts and writing SQL. Before and after the core analysis, many tasks need to be done well to lead to successful project outcomes, including the following:
- Identify a use case/problem
- Define the use case/problem
- Ingest data from one or more sources
- Prepare data via cleansing and transformations
- Analyze the data
- Build reports and/or dashboards
- Share the results with key stakeholders
When data leaders use narrowly-focused tools (i.e. LeetCode, Google Docs, IDE, etc.) to conduct technical interviews, this poses a challenge in fully qualifying a candidate’s capabilities because fewer areas of focus can be evaluated.
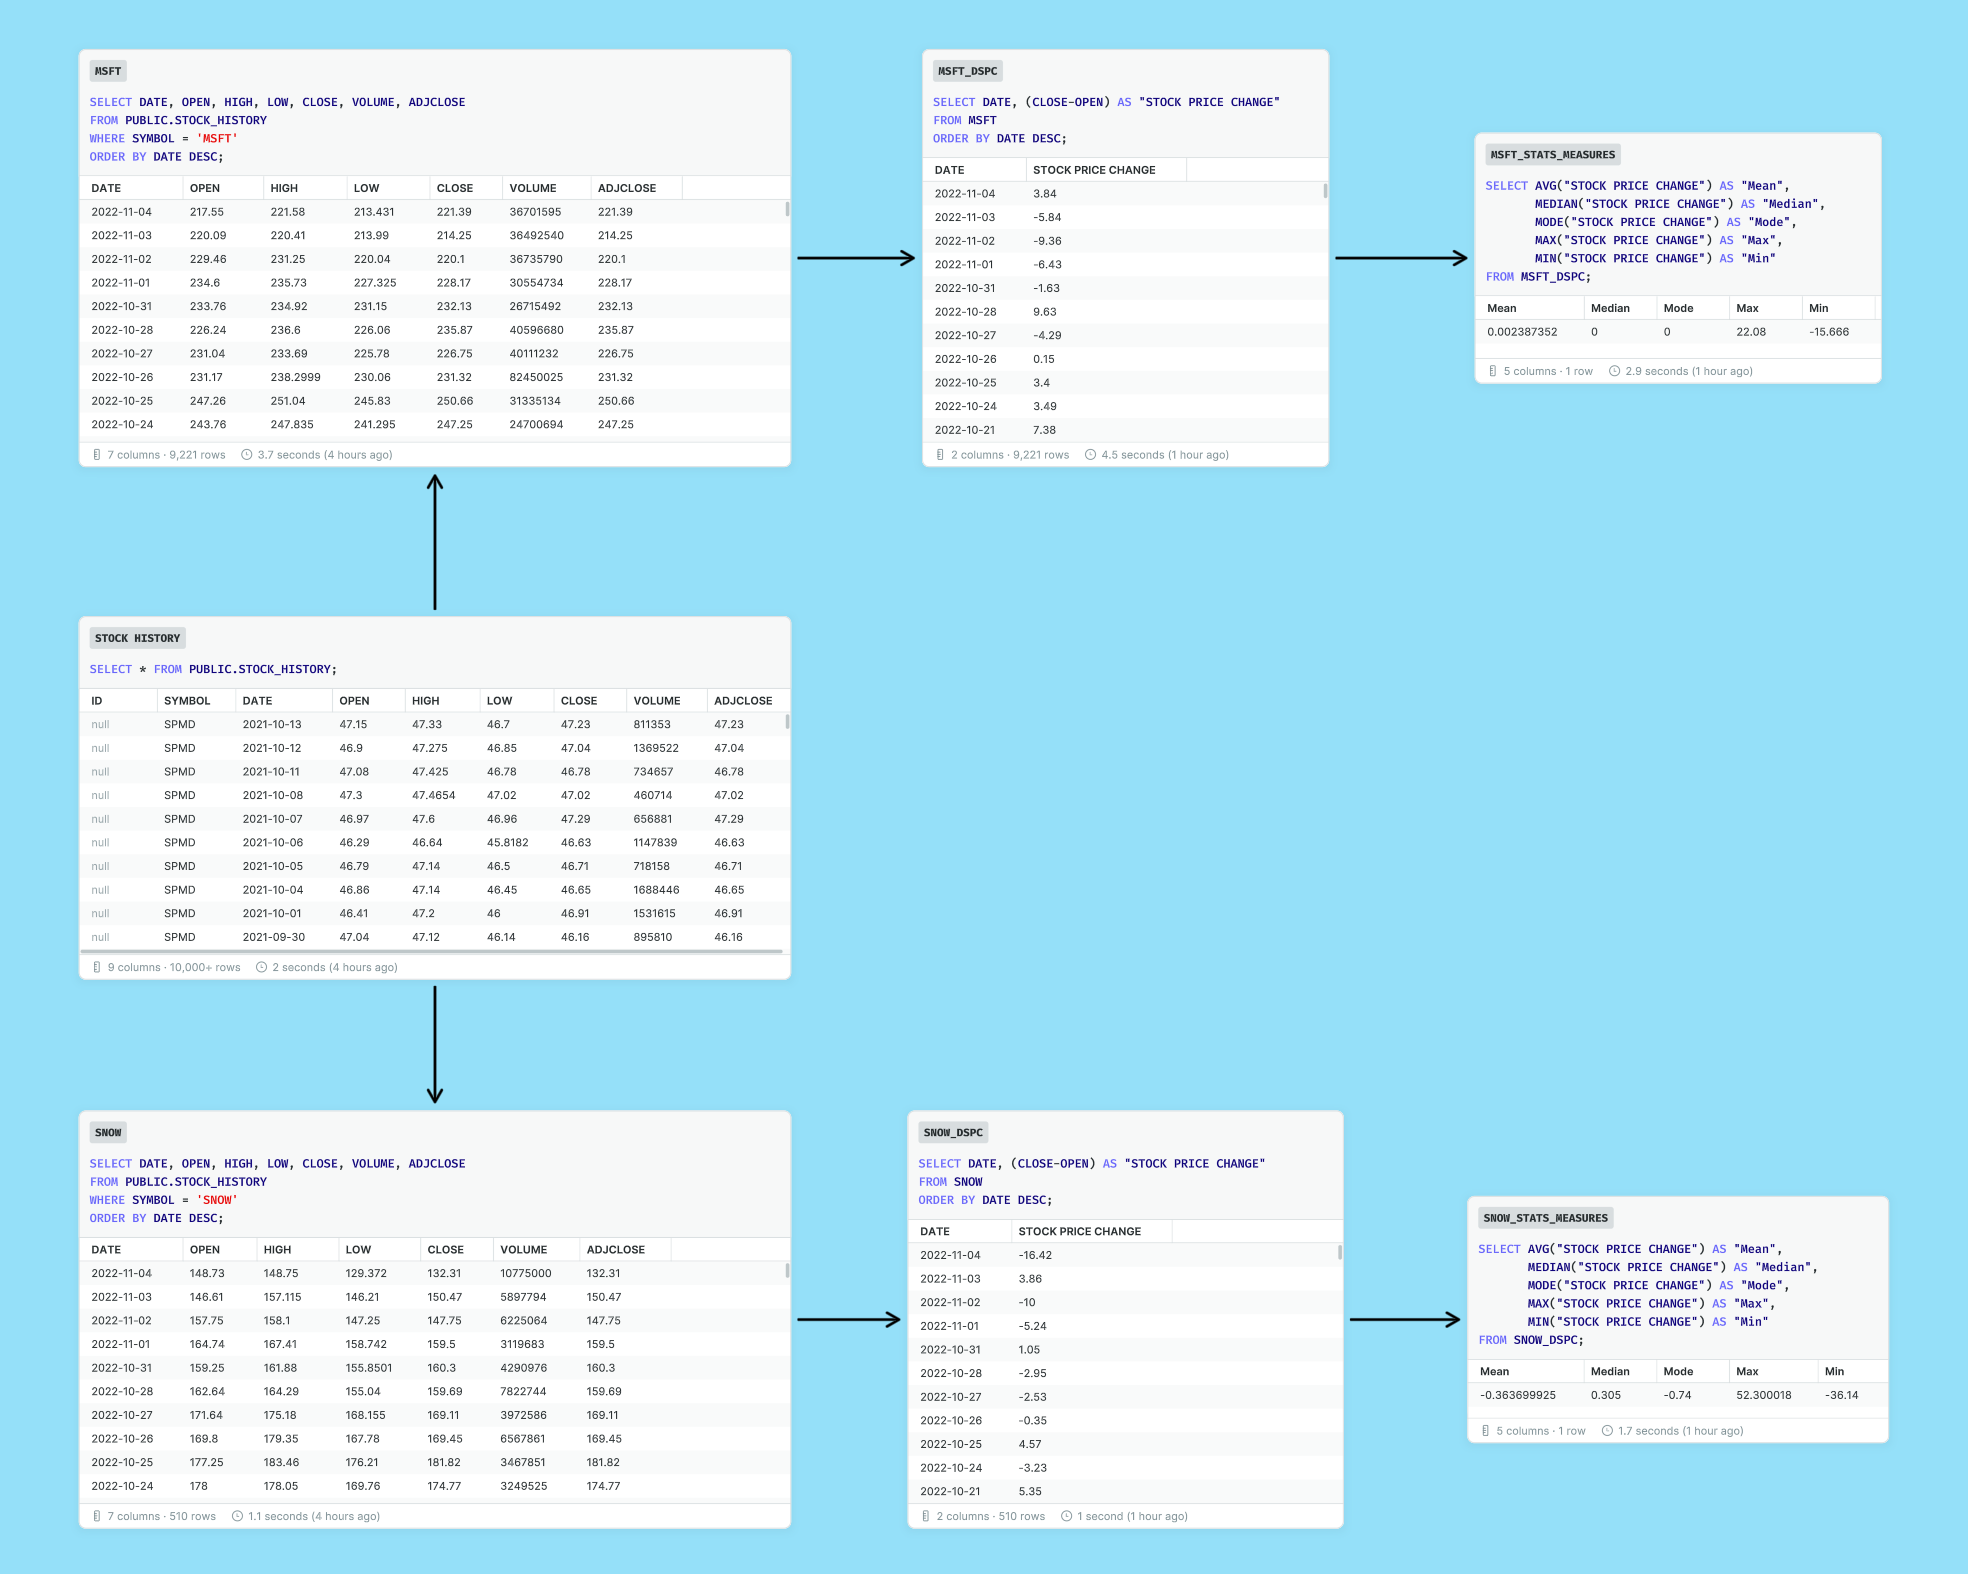
With the canvas, interviewers can explore all focus areas in one place. Either by asking candidates to explain a project via whiteboarding or walk through a prepared use case with everything that's needed on the canvas screen.
The canvas has all the sticky notes, shapes, and text boxes that a virtual whiteboard usually has for you to communicate the business problem or explain concepts. But what’s even better is users can leverage all these tools alongside their SQL code and visuals!
Real-time, Multi-user Collaboration
Any best practice content on conducting interviews will say that a good interview process should aim to emulate and test a candidate in as close to a “real-life setting” as possible. This is difficult to do at the best of times, but is now even harder because interviews are often held remotely.
Generally speaking, interviews are unidirectional. The candidate is forced to do all the work with an audience watching their every move - this isn’t very life-like! Because our canvas enables multi-party collaboration, this can change. Data leaders can now involve their teams in a more hands-on candidate evaluation process. The interviewers can actually write queries collaboratively in the same document, input their own ideas, and actually work with the candidates as if they were a current team member.
Iterative, world-class coding environment

One of the greatest strengths of the canvas is how it allows complex SQL to be laid out clearly and transparently. Each query is represented by a cell whose results can be referenced by any other cell, allowing multi-stage queries to build on one another and query results to be visible to all.
This is an optimal workflow for most instances, but even moreso when it comes to technical interviews where the pressure and stress makes coding particularly tricky. For technical interviews I've completed as a candidate, I've been asked to do certain tasks that I usually don't do in my day-to-day like writing SQL queries or python in a Google Doc without any features that let me test or run my code to code the most optimal solution.
With the canvas, all the things analysts use and expect, like autocomplete and database compiler errors, are visible, collaborative and give analysts a fair chance to write code the way they’re used to.
Count's data canvas provides a flexible interface where both the interviewer and interviewee can work together in a more natural and collaborative environment. It enables candidates to do more and lets them showcase their skillset, resulting in a 360 view for the interviewer and bringing out the best in the candidates. So next time you're looking to hire data professionals, consider using a data canvas.
