The Power of Radical Transparency
How to turn your data team into problem-solving ninjas.

How to turn your data team into problem-solving ninjas.
The Modern Data Stack has undeniably changed our data teams. It brought in new tools (dbt), new roles (analytics engineers), and entirely new domains (data orchestration). And while these improvements made our data stacks more reliable, nimble, and compliant, there is one area that remains stubbornly unaffected by the MDS: driving business value.
How we translate our work into valuable business decisions, remains as vexing as ever. Trust, data literacy, data culture, access to the right data, and effective communication are just some of the barriers we come across in translating data into meaningful, actionable insights for our business partners to use.
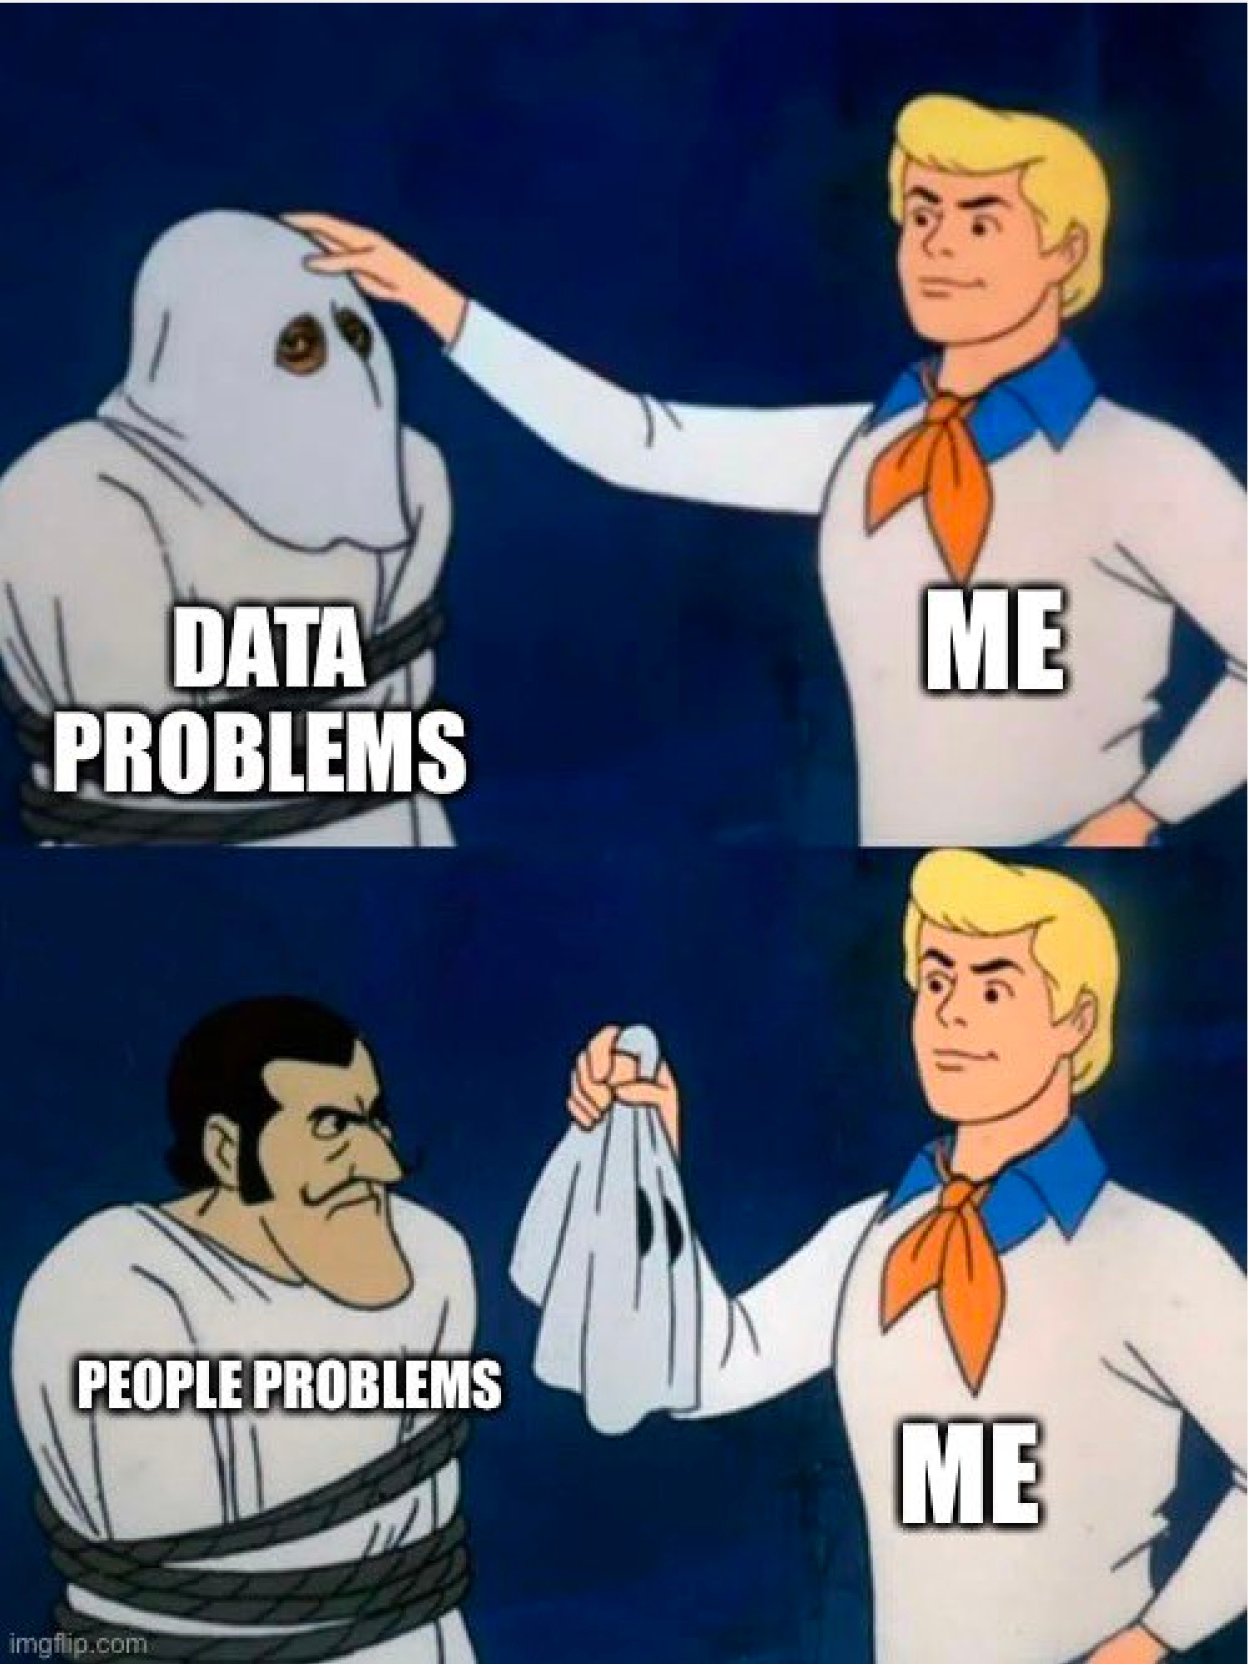
These are problems that cannot be fixed with faster queries, or state-of-the-art data streaming. And yet they are no less valuable than they’ve ever been. These are not technical problems, and most often are not even data problems. These are people problems. And they can make or break your data team**.** Indeed even the best-in-class data stack will fail to have any real impact if these people problems are ignored.
We learned this the hard way
In 2019, Count launched a SQL notebook. The idea behind the notebook came from our frustration with dashboarding tools, namely that they presented contextless charts, without any ability to tell stories or handle nuance and complexity.
We thought the notebook would allow analysts to craft narratives with their analysis, letting them better explain their work to stakeholders.
Unfortunately, this wasn’t the case.
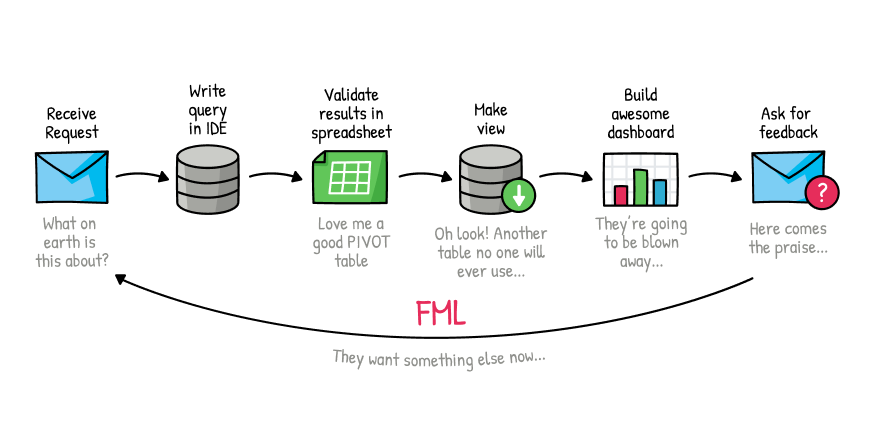
While the notebook improved the analysts’ workflow, the interface did little to change the dynamic between analysts and their business stakeholders. In particular, analysts were still spending weeks crafting an analysis only to find entirely new requirements and questions when it was shared with their stakeholders.
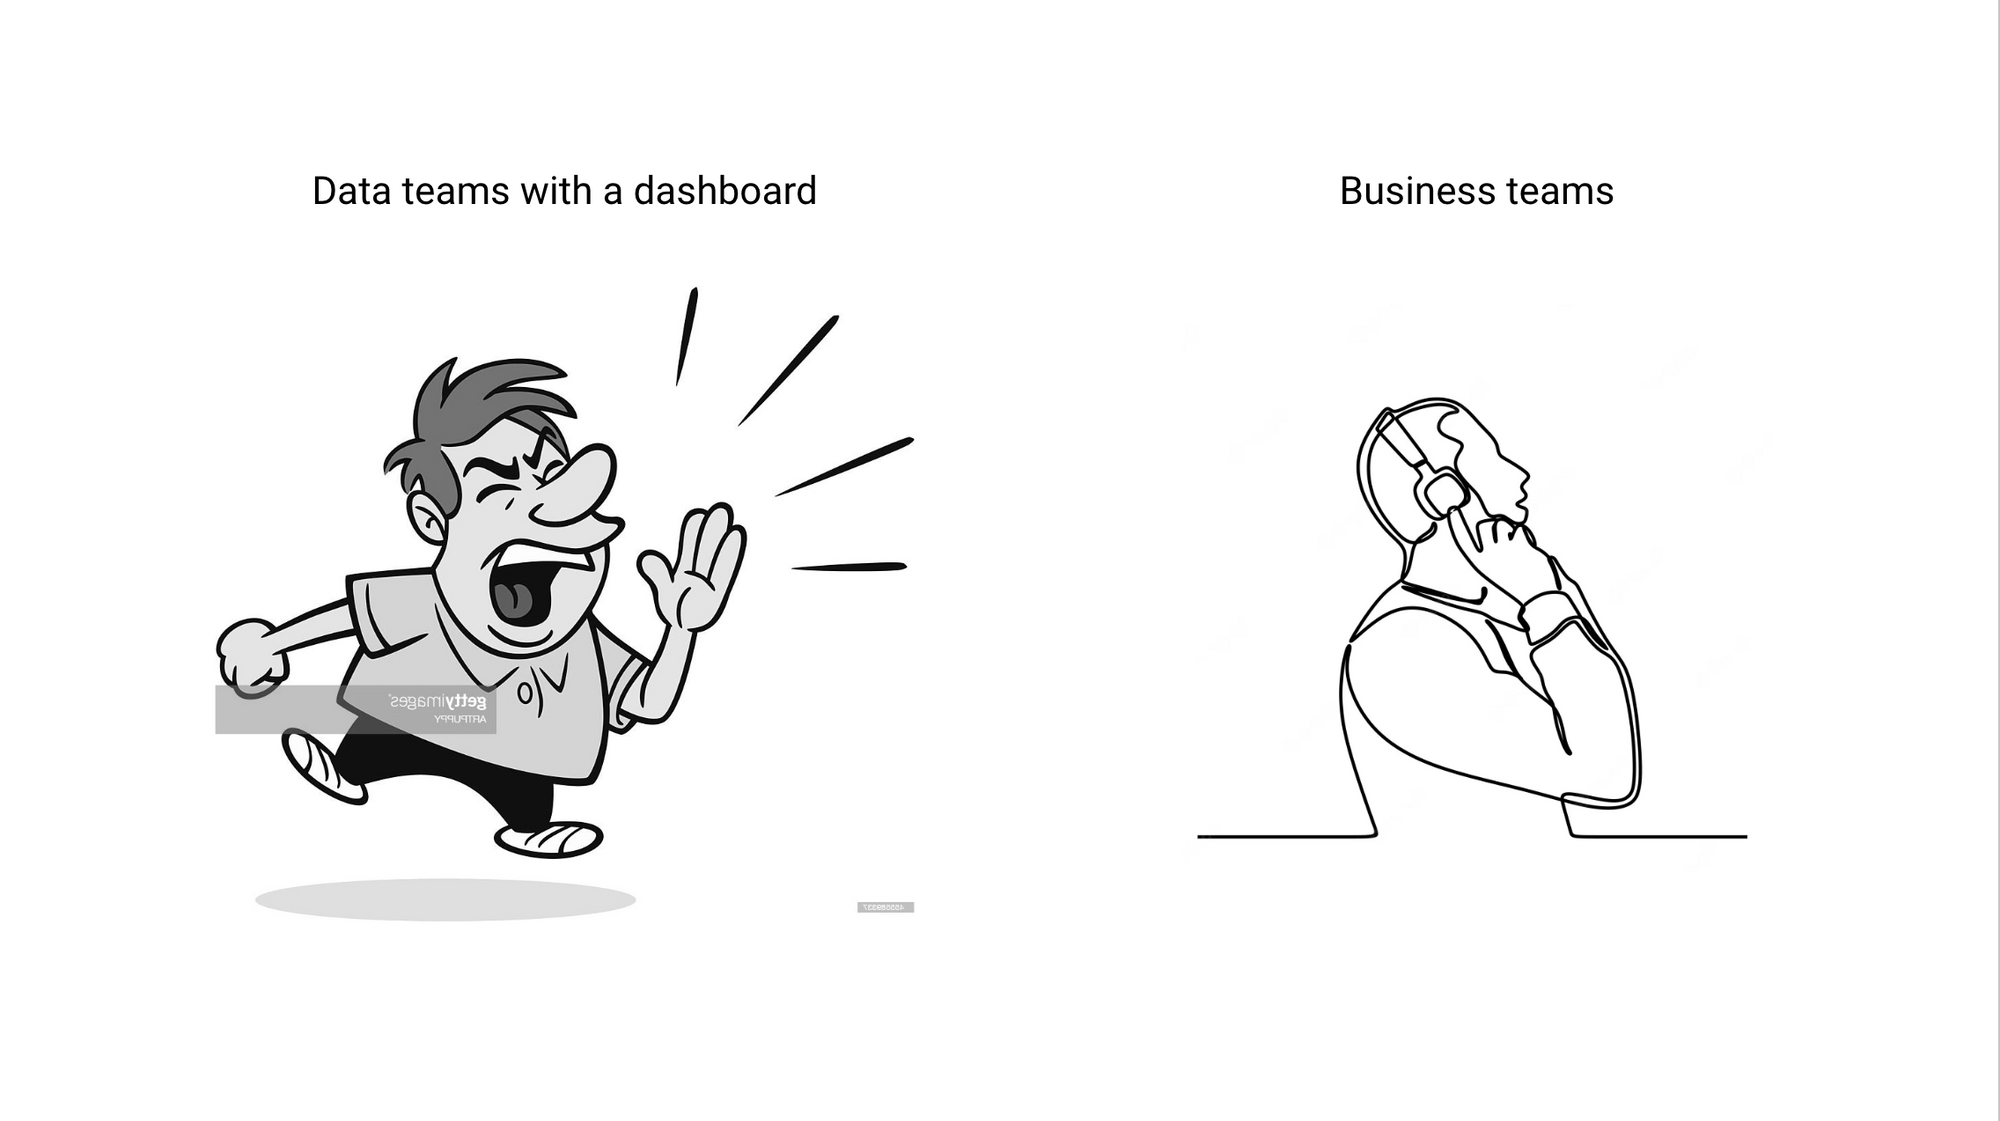
The fundamental problems of trust, workflow, and effective decision-making were still as present as ever. We realized this was because a notebook was just an extension of a dashboard - if a dashboard was a way for you to try to shout at your stakeholders to get their attention, then a notebook only amplified that voice. Fundamentally both are one-way communication devices that limit how we interact with our business partners.
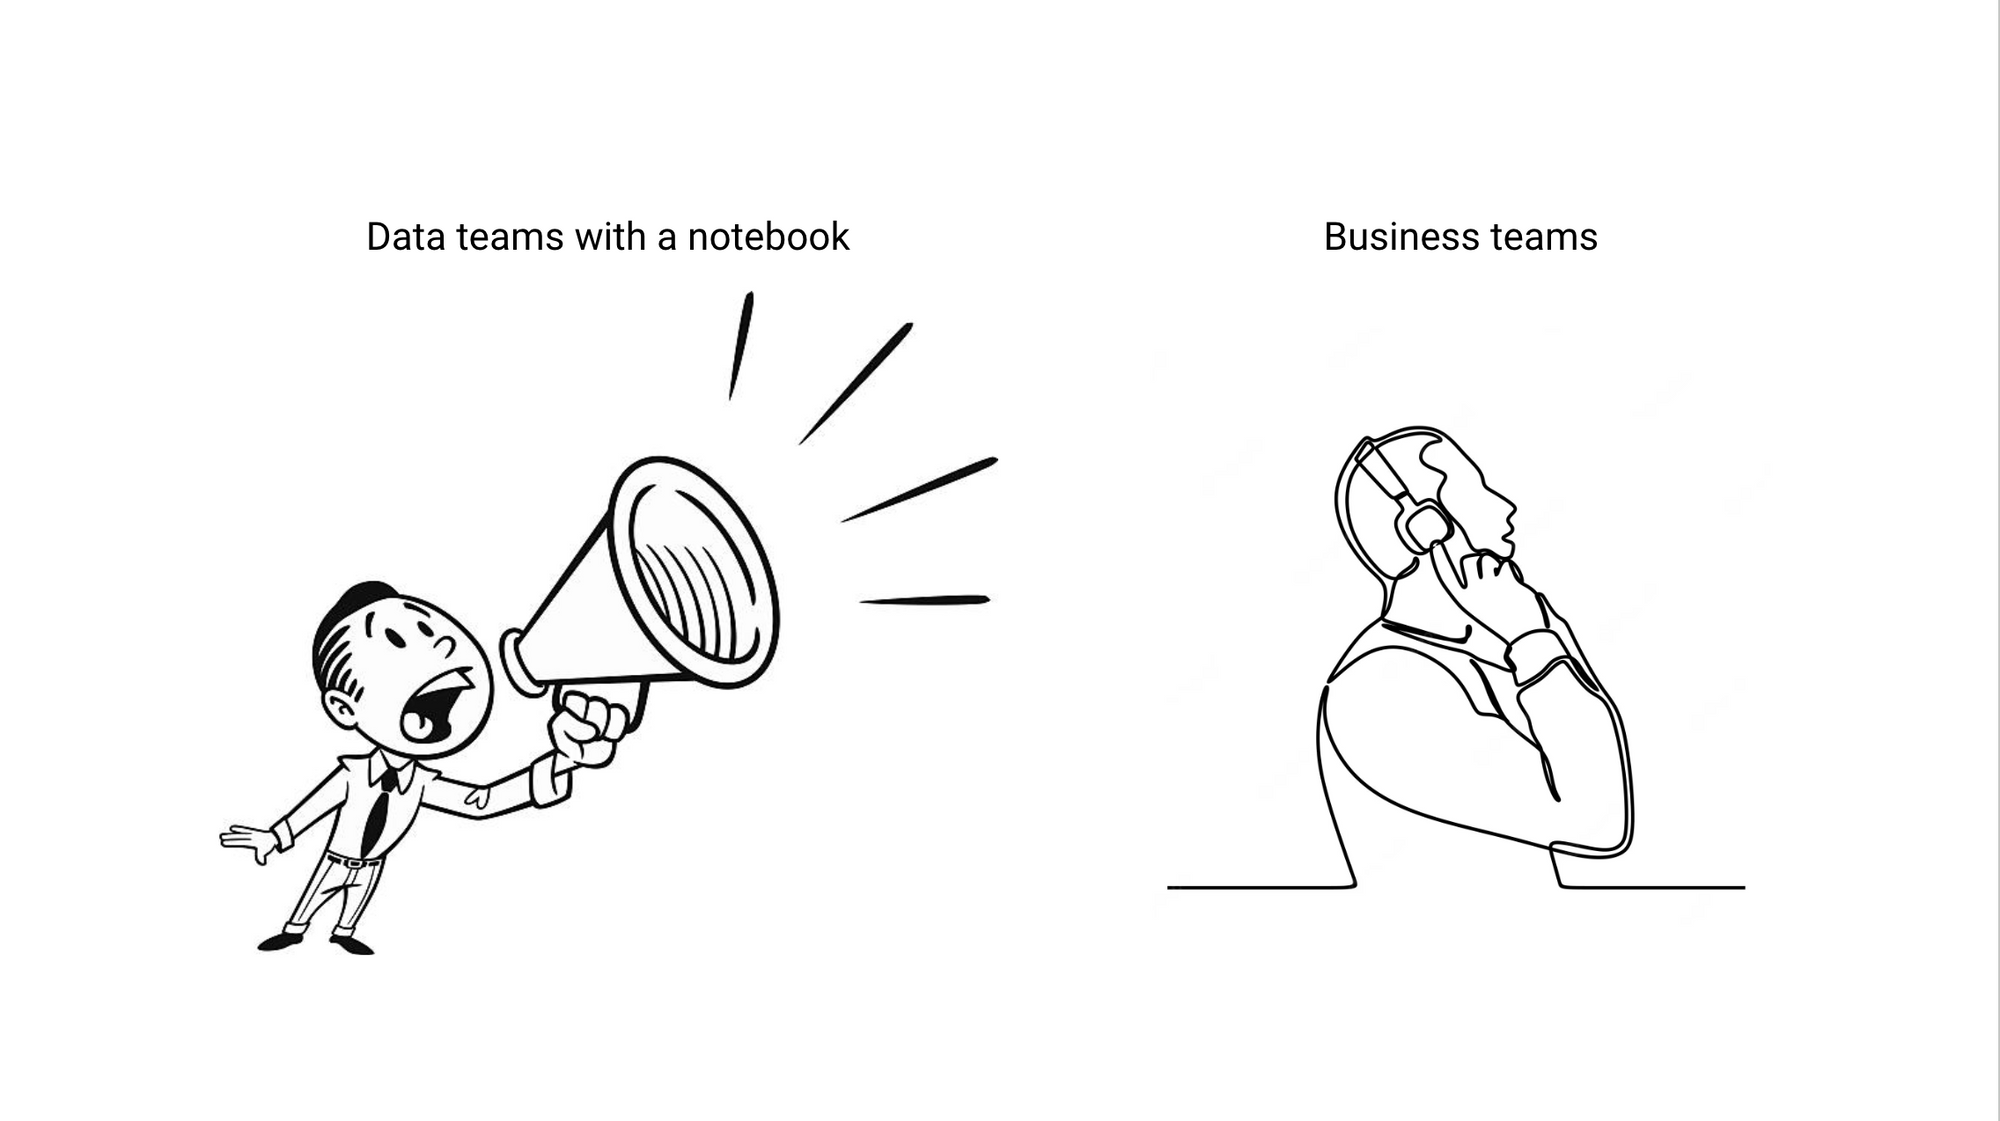
Giving analysts a louder voice wasn’t going to solve our core problems. However, this experience helped us to better understand what these core issues are:
1. Our workflows make it hard for stakeholders to trust our work
It’s hard for anyone to blindly trust some numbers you see in a chart without really understanding how they got there. Dashboards and notebooks hide the path we took to arrive at our answers and obscure our methodology to the point of mistrust.
2. Data teams are under-utilized. We are great at solving problems but are given tasks
Data teams operate best when they are given a problem (e.g. help us figure out why churn has gone us) vs a task (e.g. pull a table of all of the customers that have churned in the last 90 days).
3. Data tools don’t help us think
Our tools perpetuate this task-centric approach by encouraging us to create single queries, visuals, or outputs like dashboards rather than letting us find patterns between all of these different outputs.
A different approach
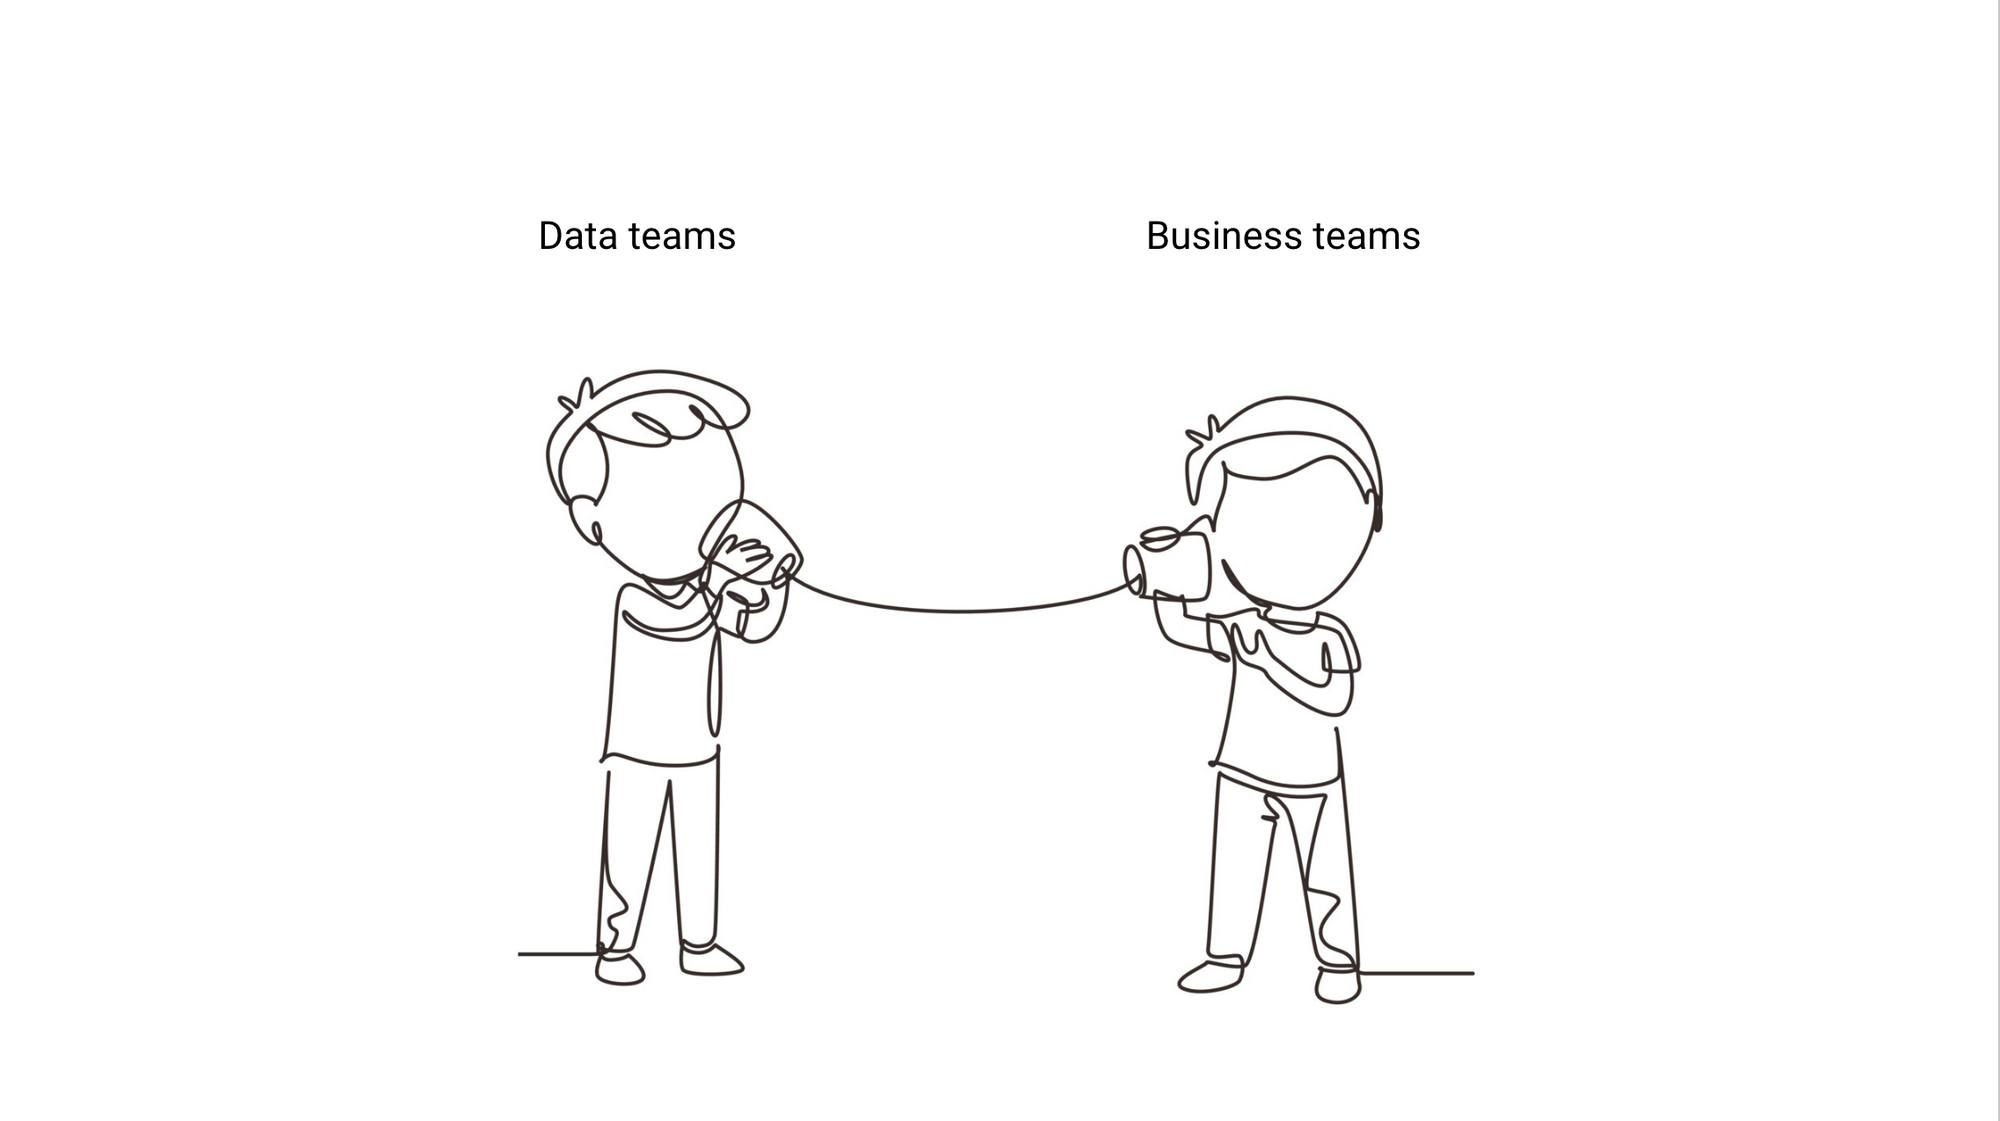
We knew it was time for a new approach, one that would go beyond megaphones and start to open up communication between data and business teams, with the ideal outcome that data teams become problem-solvers, not taskmasters.
In talking with hundreds of data teams, we discovered one thing that separated data teams who had good relationships with their business teams and those that didn’t: radical transparency.
These teams were open about their work and shared the problem and methodology, not just the chart that was requested. They were rarely asked to complete tasks but instead were given problems. By being open, these teams solved the people problems that got in the way of data-driven decision-making, and ultimately drove farm more impact than those that didn’t employ radical transparency.
And so we set out to build a tool centered around the value of radical transparency. This meant we needed:
- A bi-directional tool (no more megaphones)
- A tool that was powerful enough for data teams to solve problems (not complete tasks)
- A tool flexible enough to explain how you arrived at your answer (not just your answer)
This was how the canvas was born.
A notebook in 2D
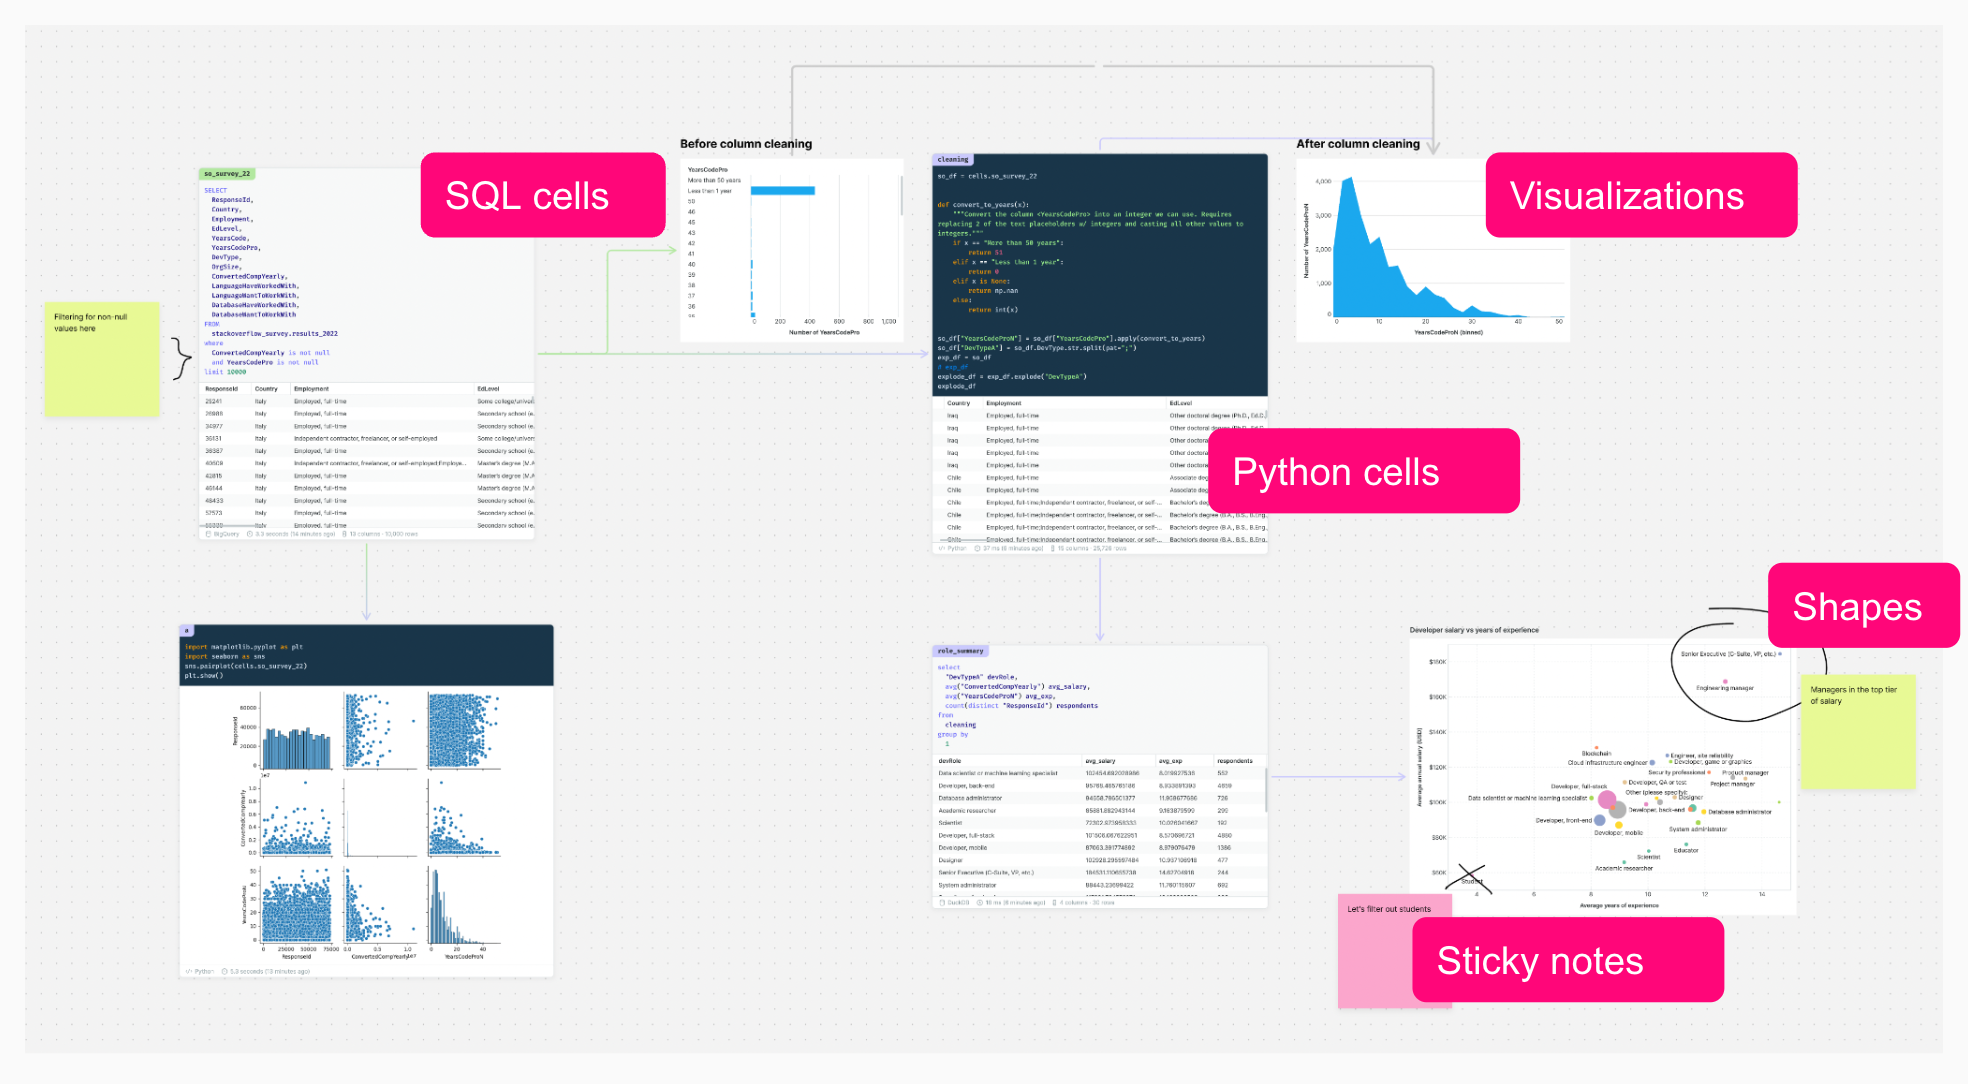
Essentially, the canvas is a data notebook in two dimensions.
It has:
- SQL & Python cells
- Visualizations (via Python & via drag-and-drop builder)
- Interactive filters & parameters
- Sticky notes, shapes, and objects
These building blocks all in the context of a real-time collaborative whiteboard offer a fundamentally different experience for analyzing and discussing data:
Work spatially
Doing your analysis in the space of the canvas means you can do things that were impossible in IDEs or notebooks. Being able to lay out your work as you tackle a problem is invaluable in helping to evaluate possible solutions. Moreover, very simple things like comparing multiple versions of the same query becomes trivial.
Work through multiple steps without switching tools
When doing a piece of analysis before it was common to switch between several tools: maybe Slack to communicate with your stakeholder, an IDE to prototype your query, a BI tool to visualize, and Slack again to share and discuss findings.
This endless tool switching makes it impossible to trace back your steps to explain why you’ve done something, or to quickly make some tweaks when a follow-up question comes up.
In the canvas, you can include your entire workflow in one place, so when you’re presenting your slides to a coworker and they ask which filters are on that chart, you can go back to the exact query that built that visual, and walk through it.
Work together
Of course, each of these tasks can be done with others. So you and your coworker can be side by side writing queries, while your stakeholder is mapping out a business process they need measured.

How’s it being used?
How are teams using the canvas to model radical transparency and problem-solving in their organizations?
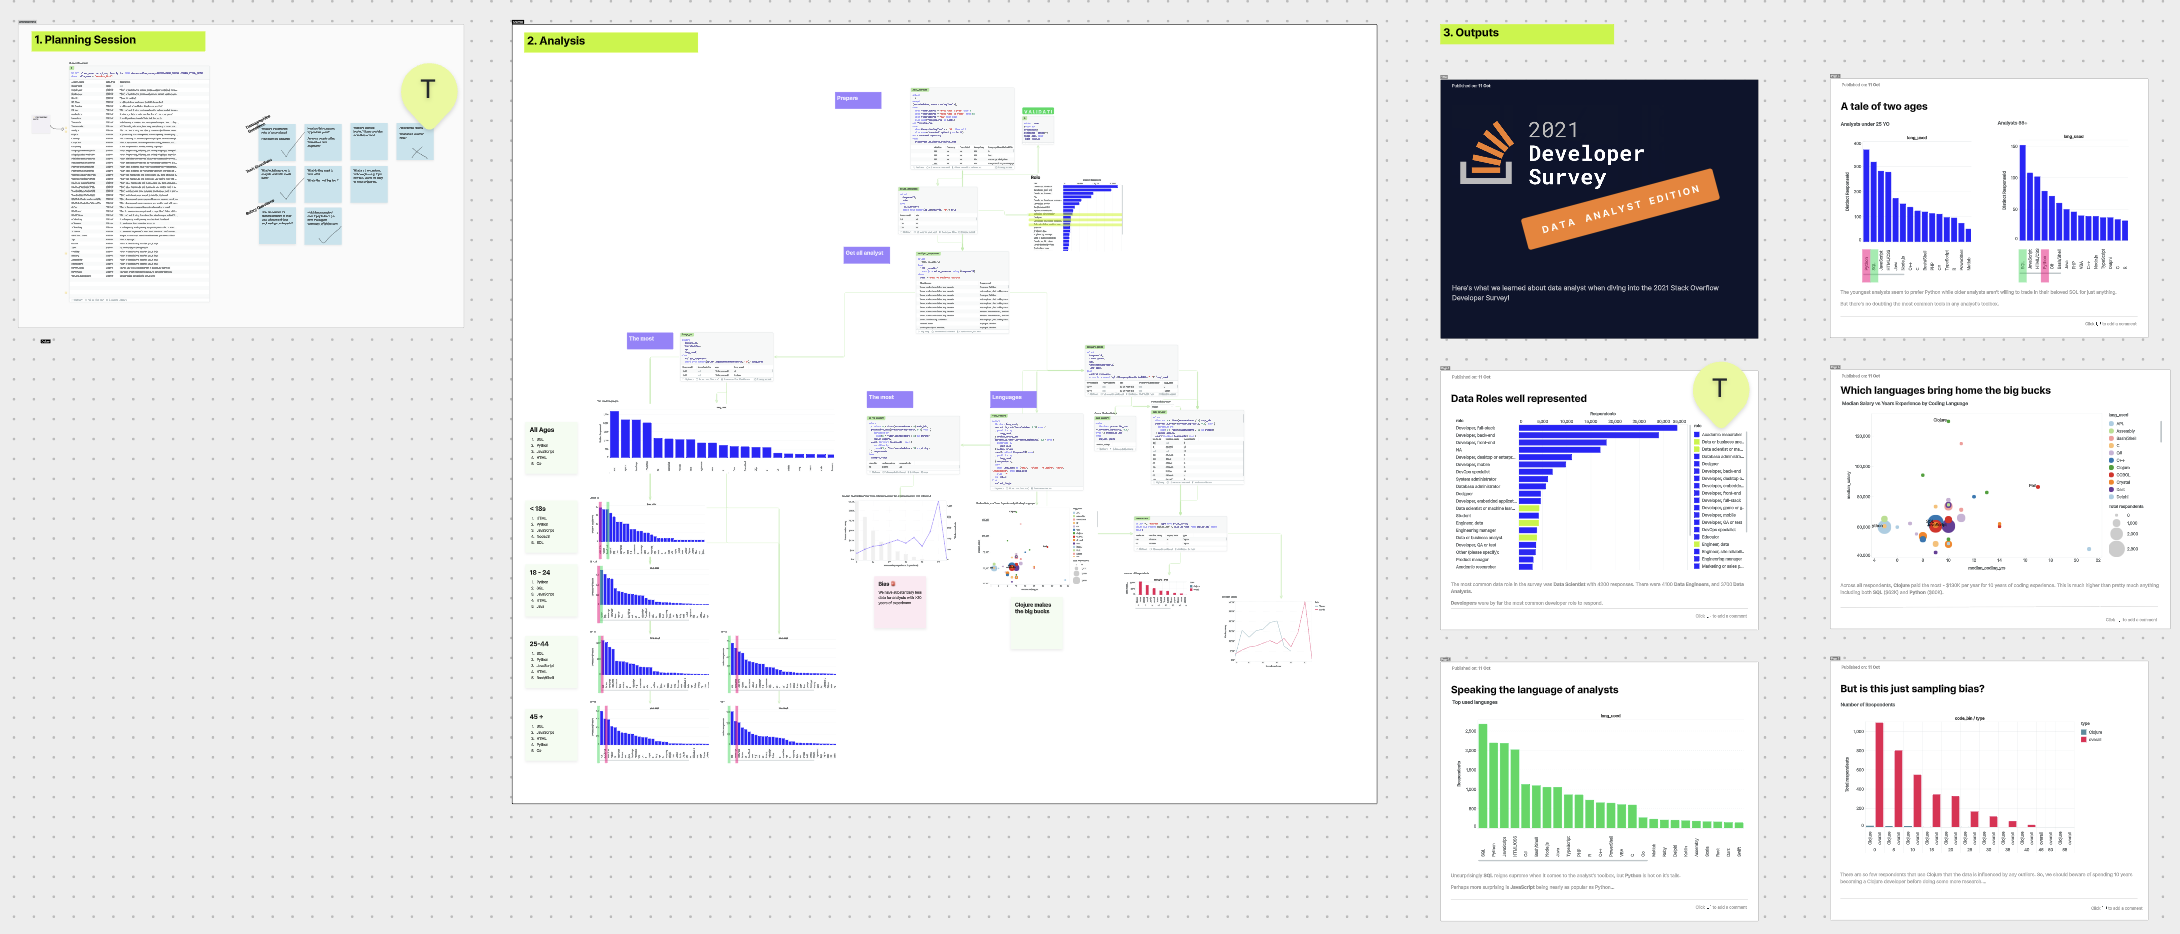
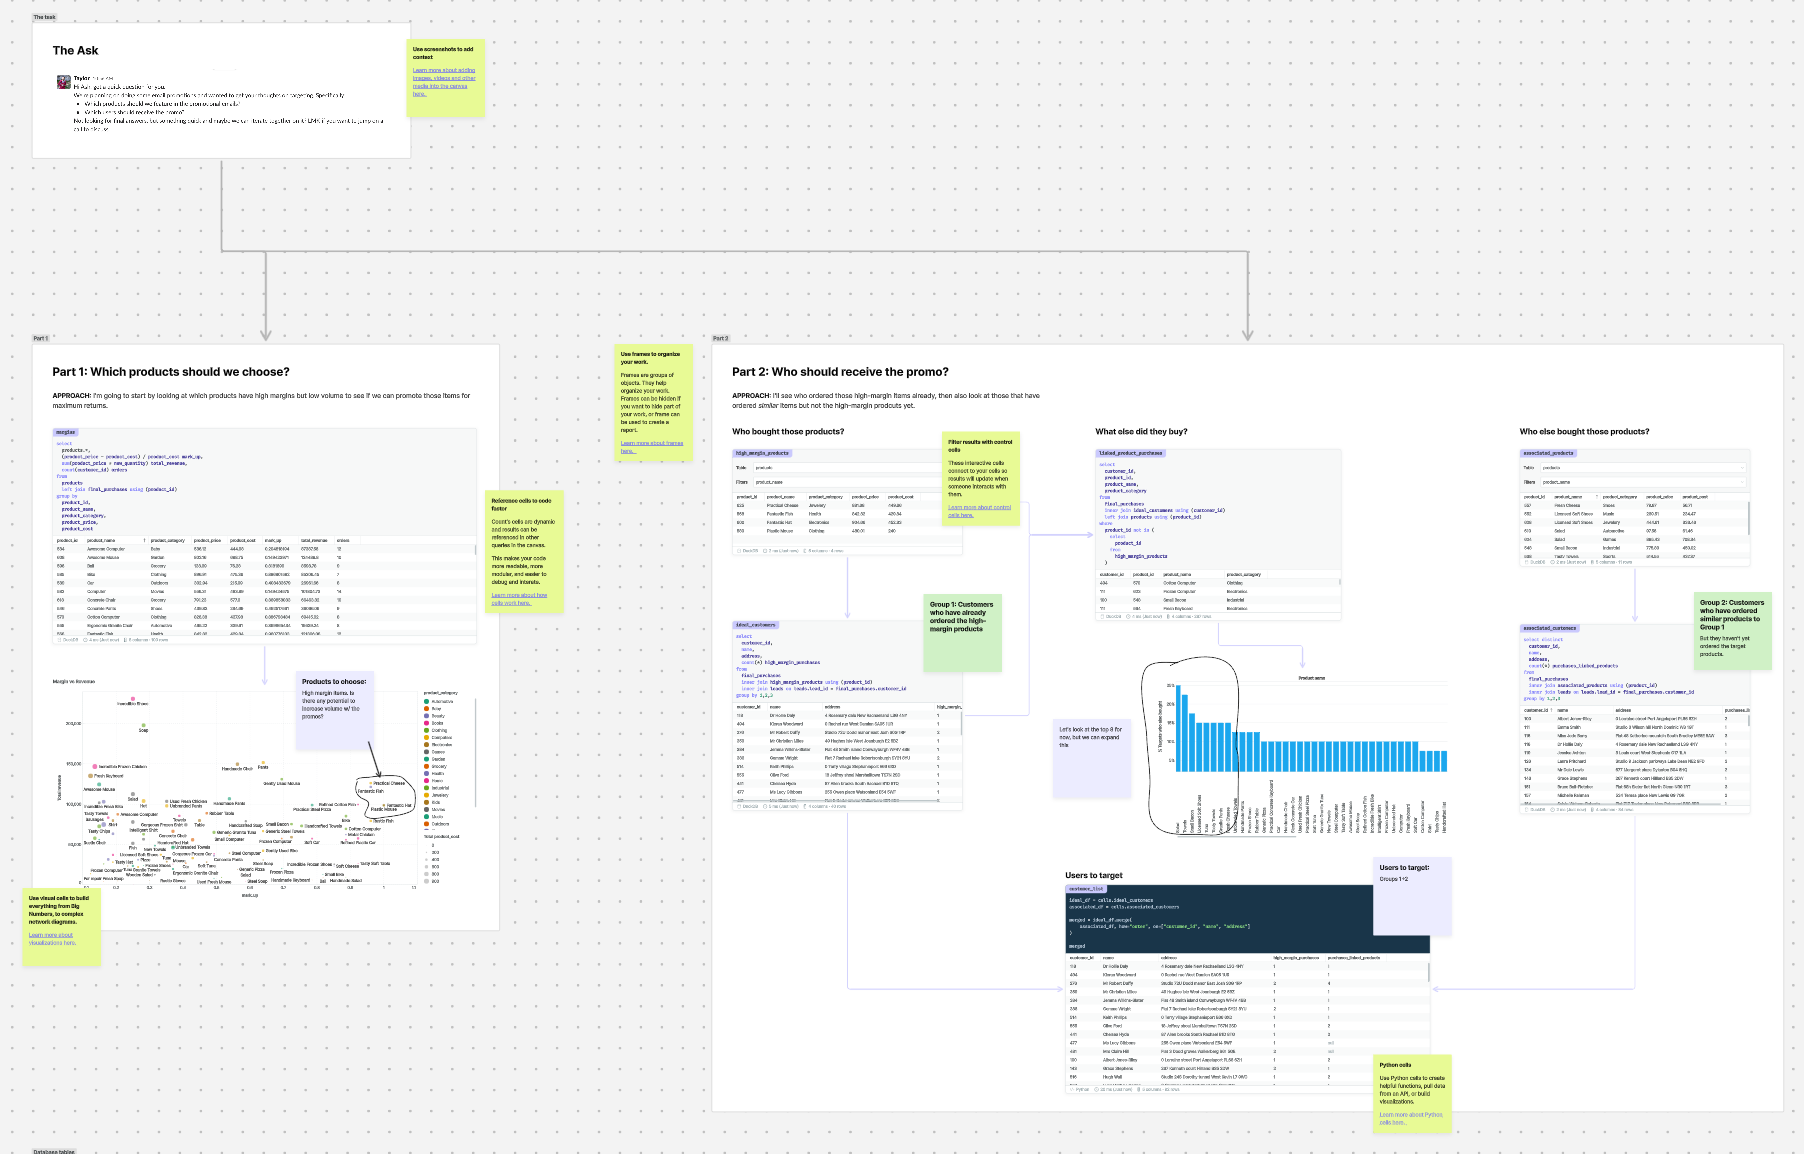
Data Exploration
Exploring a new dataset, or investigating an ad-hoc request from the business is a common use case for the canvas.
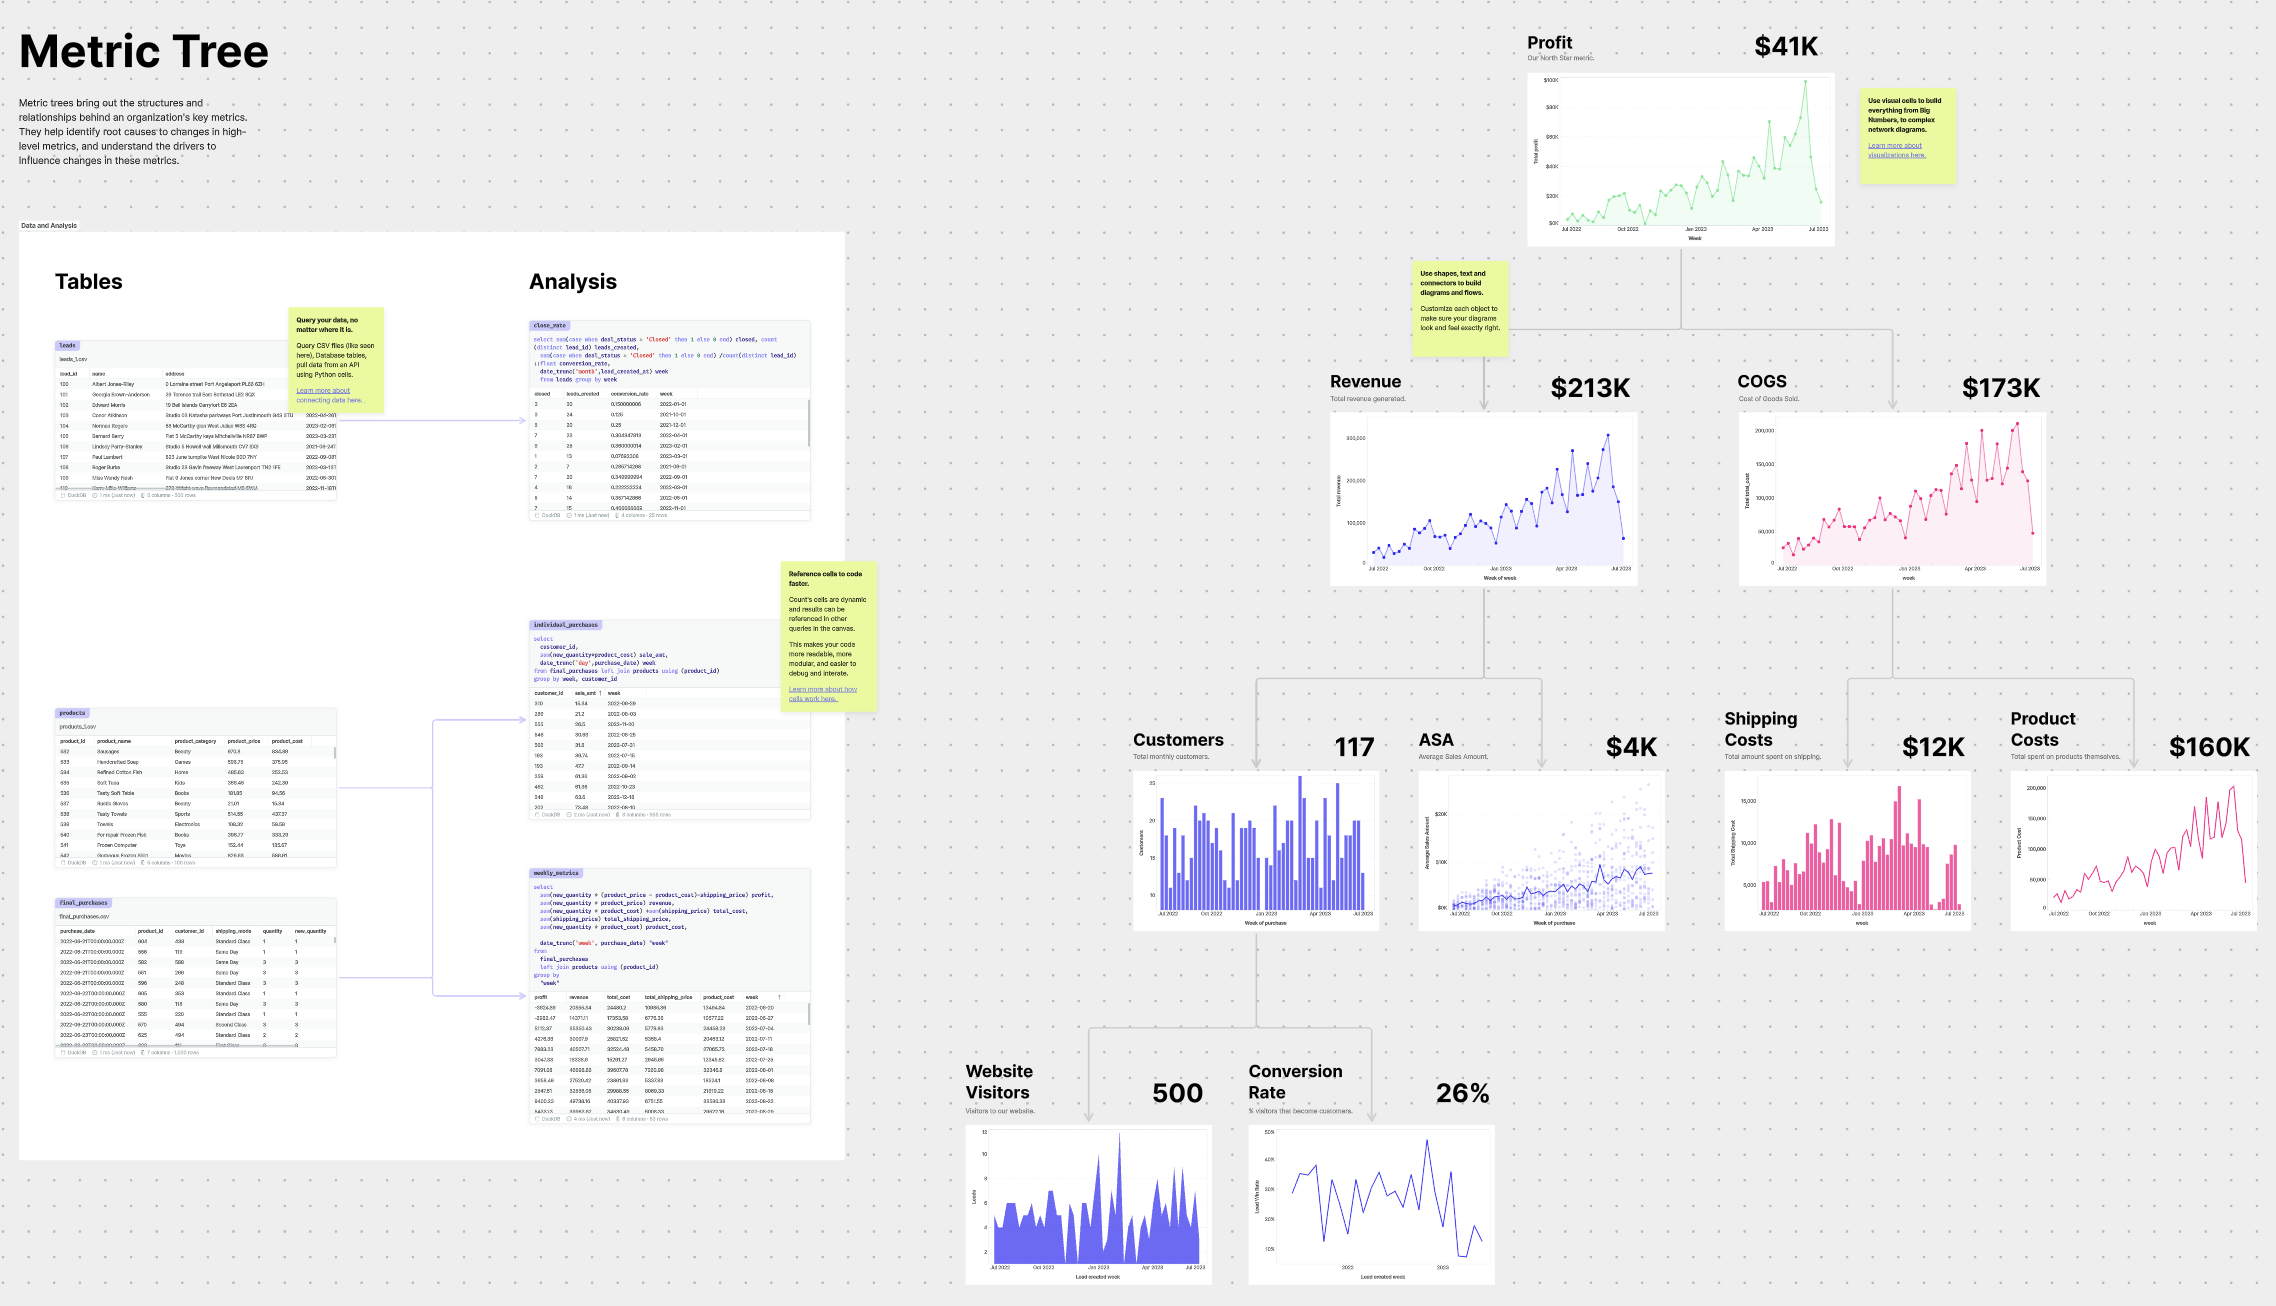
Metric Trees
Metric trees are better KPI reports. They take the fundamental drivers of a team’s key metrics and break them down into dependent metrics. This hierarchy makes it easier to spot which sub-metric is driving any changes in the high-level metric and prioritize how the team should respond.
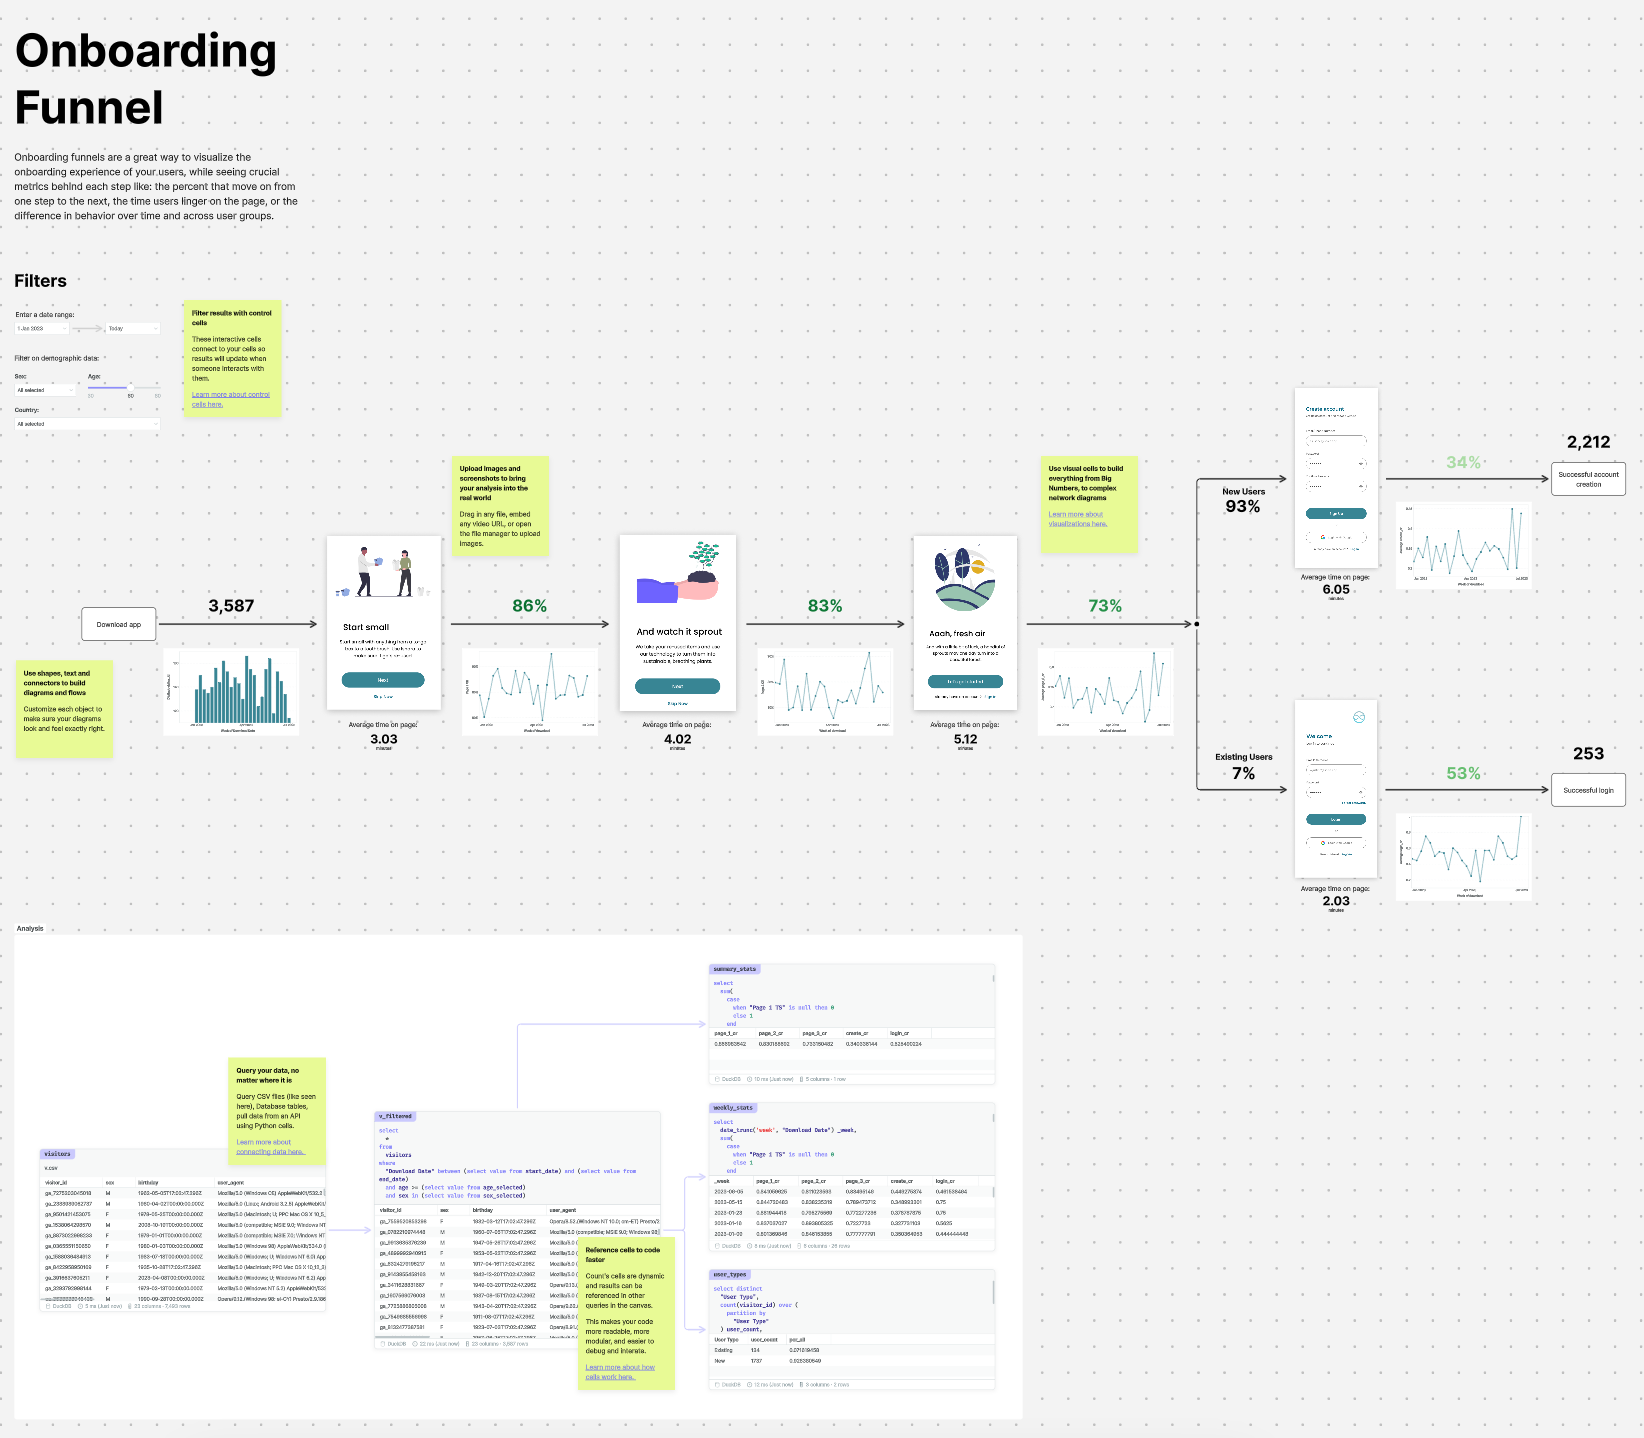
Onboarding funnels
Modeling other parts of your business in a way that’s more true to the real world is an effective way to make sure your analysis is actually being understood and used. Onboarding funnels are a great example of how the context of what the user is seeing at each point in time is critical to make decisions off on the analytics like what percentage of users complete each step.
Debugging dbt models
While dbt is excellent for orchestrating and deploying data models, when one goes wrong it can be hard to figure out exactly what’s going on under the hood. By importing a model into the canvas you can instantly break down each CTE into its own cell, getting intermediate results for each query. Then you can easily identify the source of the errors, make the necessary changes, maybe get a colleague to review your work, and export the updated model back into dbt.
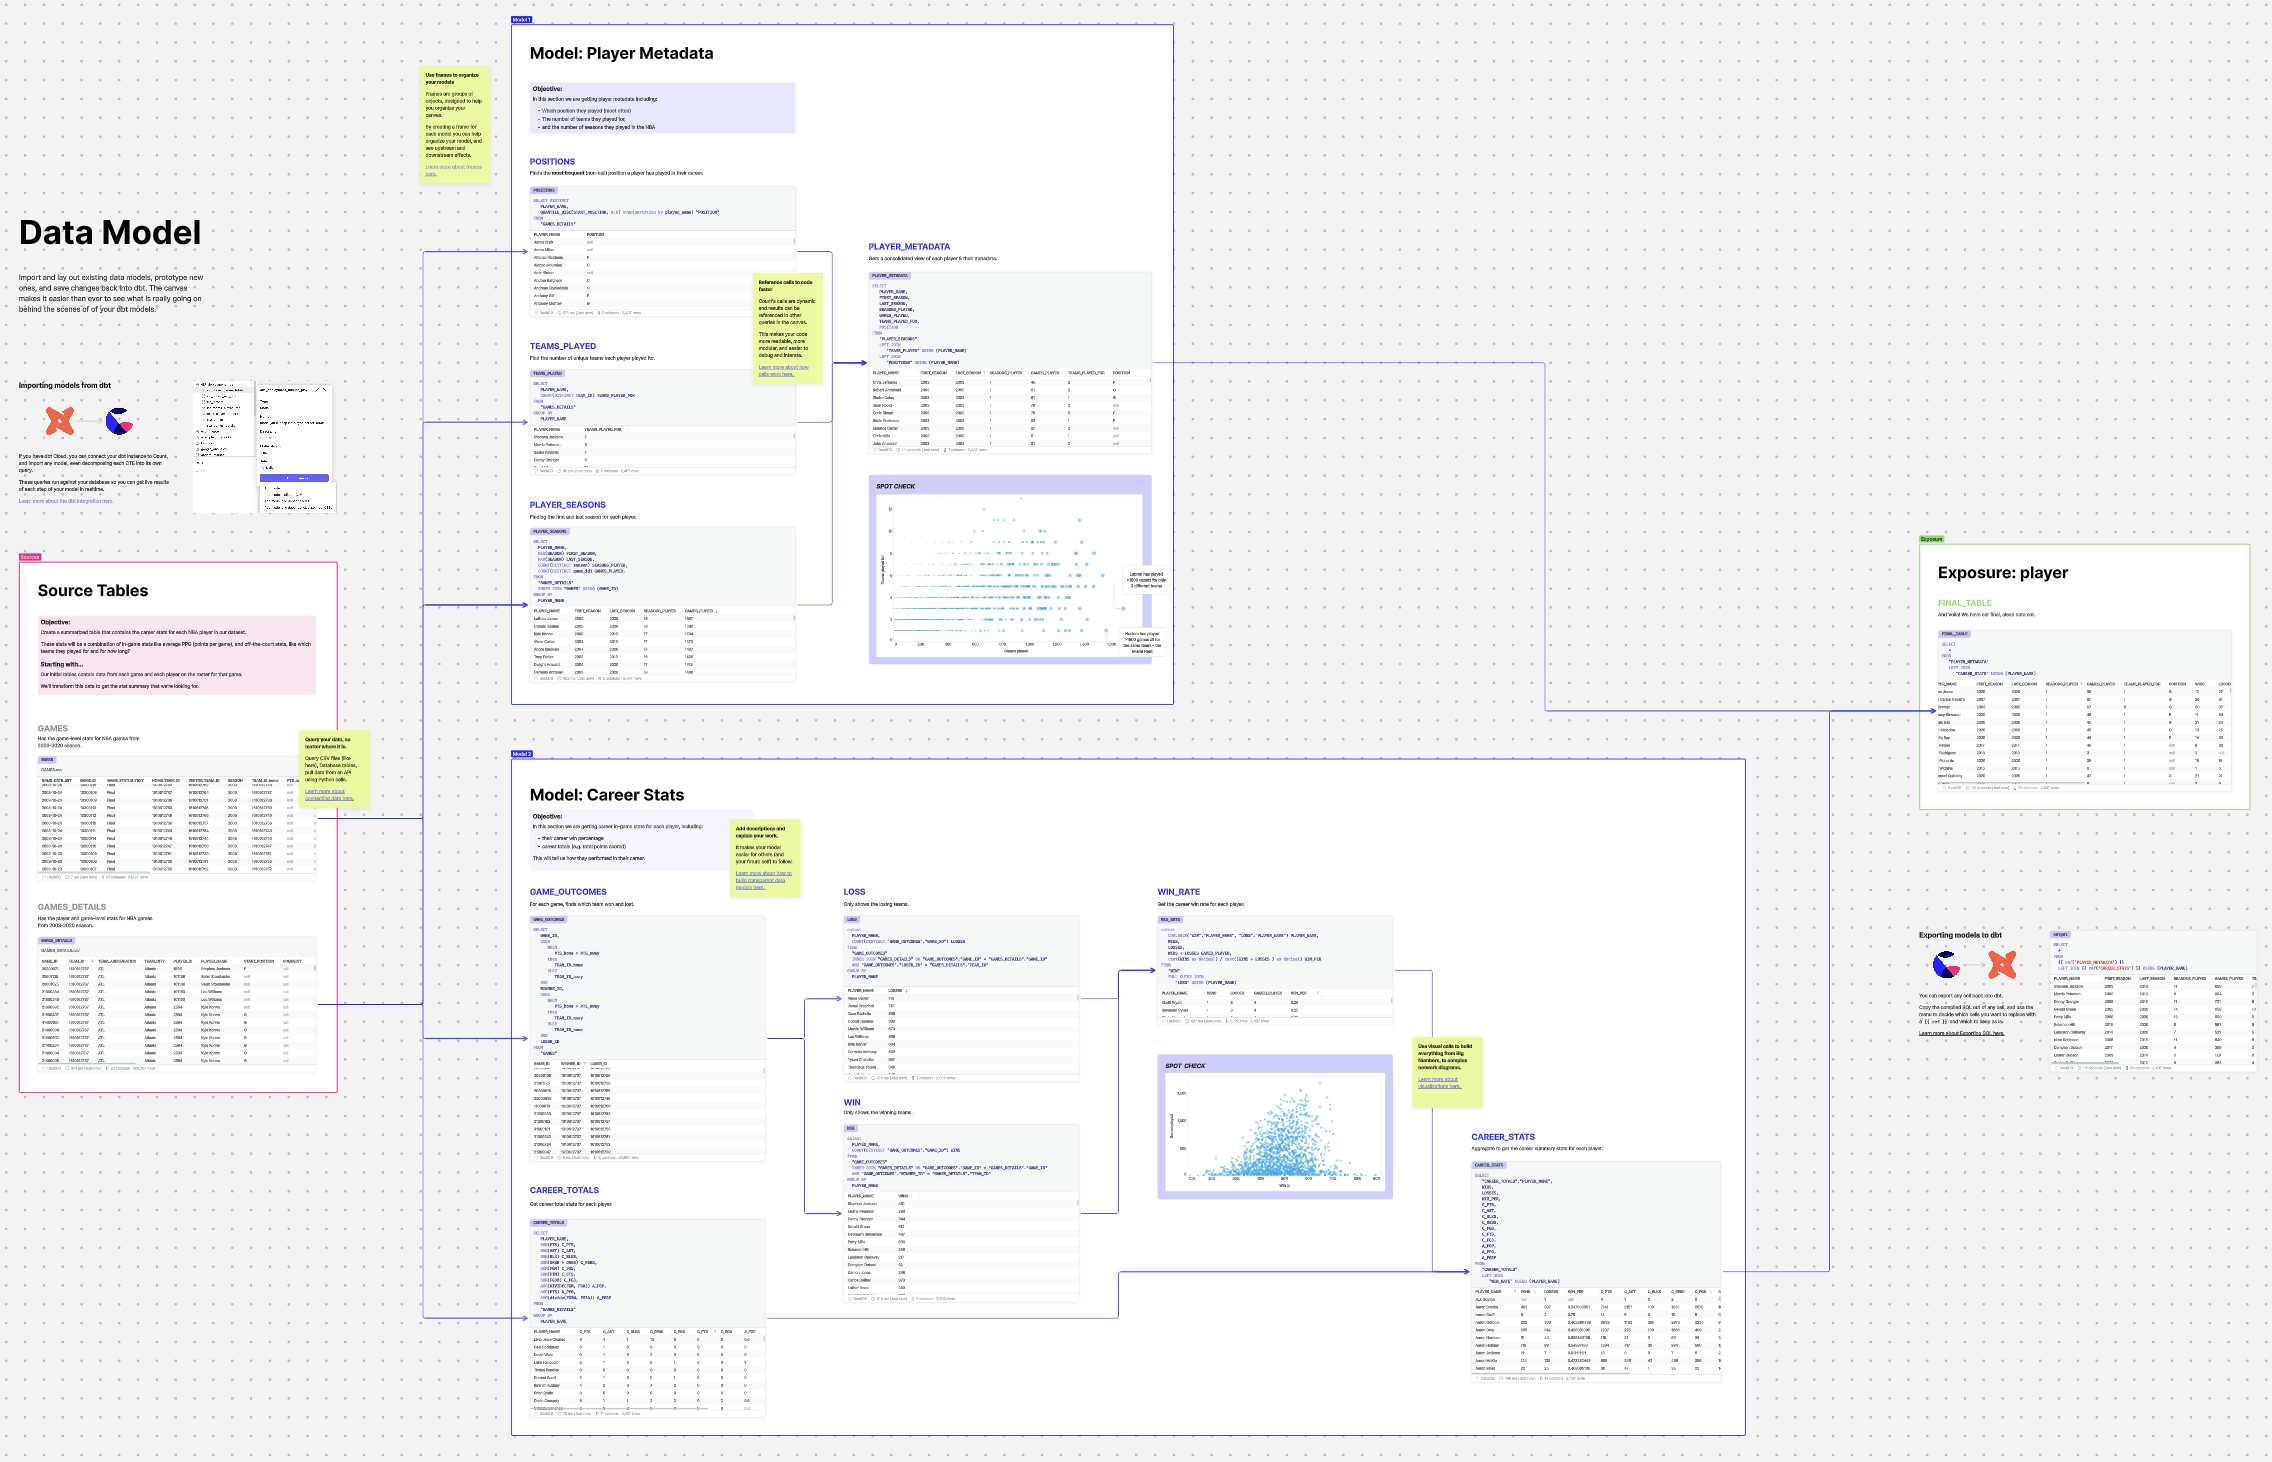
Building dbt models
When designing a dbt model from scratch its always better to prototype before building. This allows you to have more confidence not only that the code is correct, but also that it matches the stakeholder expectations. In the example below, an entire end-to-end transformation is laid out. The transformation covers multiple dbt models, each linked together, with commentary and validation along the way. A canvas like this is helpful not only for the team building the model, but also anyone trying to confidently use the model as they can see exactly how it was built.
What’s the impact?
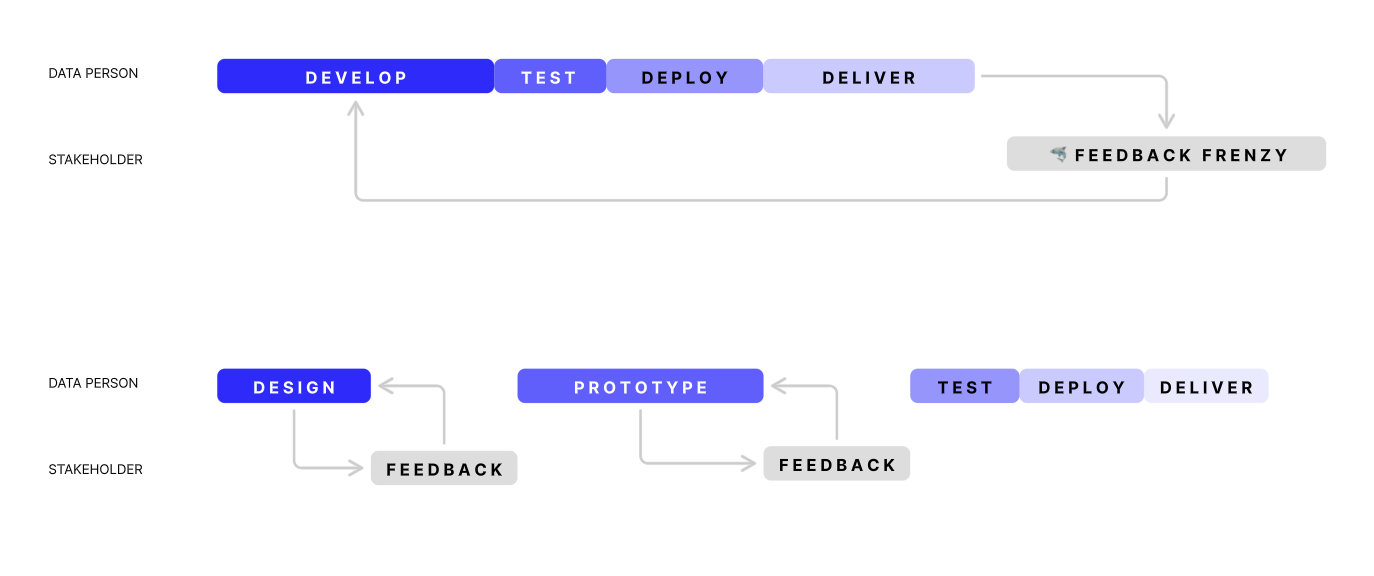
What’s not shown in those screenshots is how they were built. One of the biggest changes we see in adopting the canvas is the shift from waterfall to agile development cycles. One of the biggest sources of our people problems comes from the poor communication cycles present in waterfall development, so being able to get feedback early and often ensures we don’t waste our time on the wrong things, and our stakeholders have more trust in the work we do.
In summary, by adopting radical transparency, data teams:
- go beyond tasks and get into the problems
- don’t productionalize the wrong things
- build trust through transparency
- think through problems in 1 tool, not 10
Data teams as problem solvers
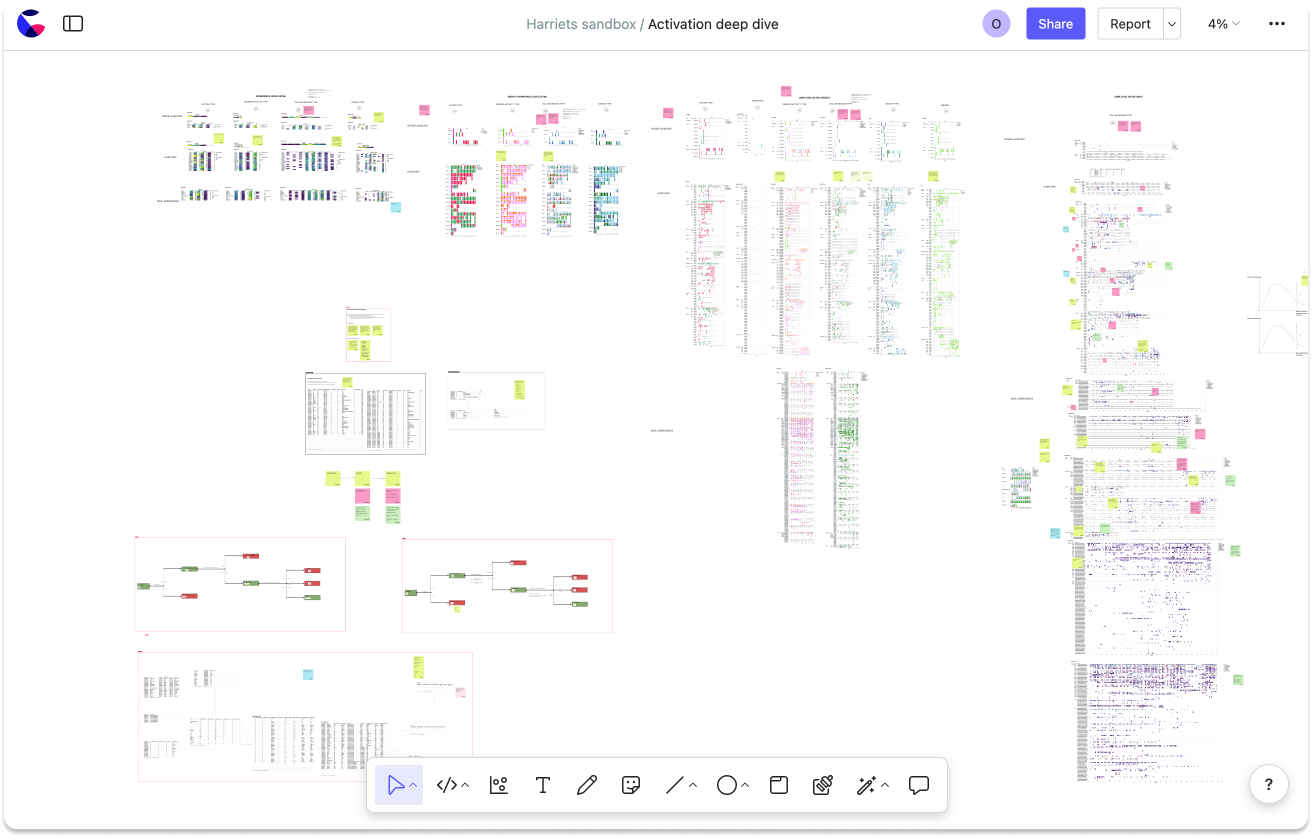
Ultimately all of this leads to the same outcome: data teams become problem solvers. To demonstrate what that means, the following canvas shows an Activation deep dive. It contains over 700 queries and visuals. Typically, this kind of analysis would be split across dozens of seemingly unrelated requests to the data team, each with its own notebook, dashboard, or visual, making it impossible to find connections between any of these.
Summary
Over the past few years, it has been an exciting time to be in data, but there is now increasing pressure to turn the investment in the modern data stack into undeniable business value. We’re convicted that radical transparency is at the heart of this solution. Allowing the data team to move away from being task-orientated into problem-orientated teams delivering tangible business value.