How we evolved our query architecture with DuckDB
A deep dive into how we used DuckDB to take our browser-first query architecture to the next level.

TL;DR
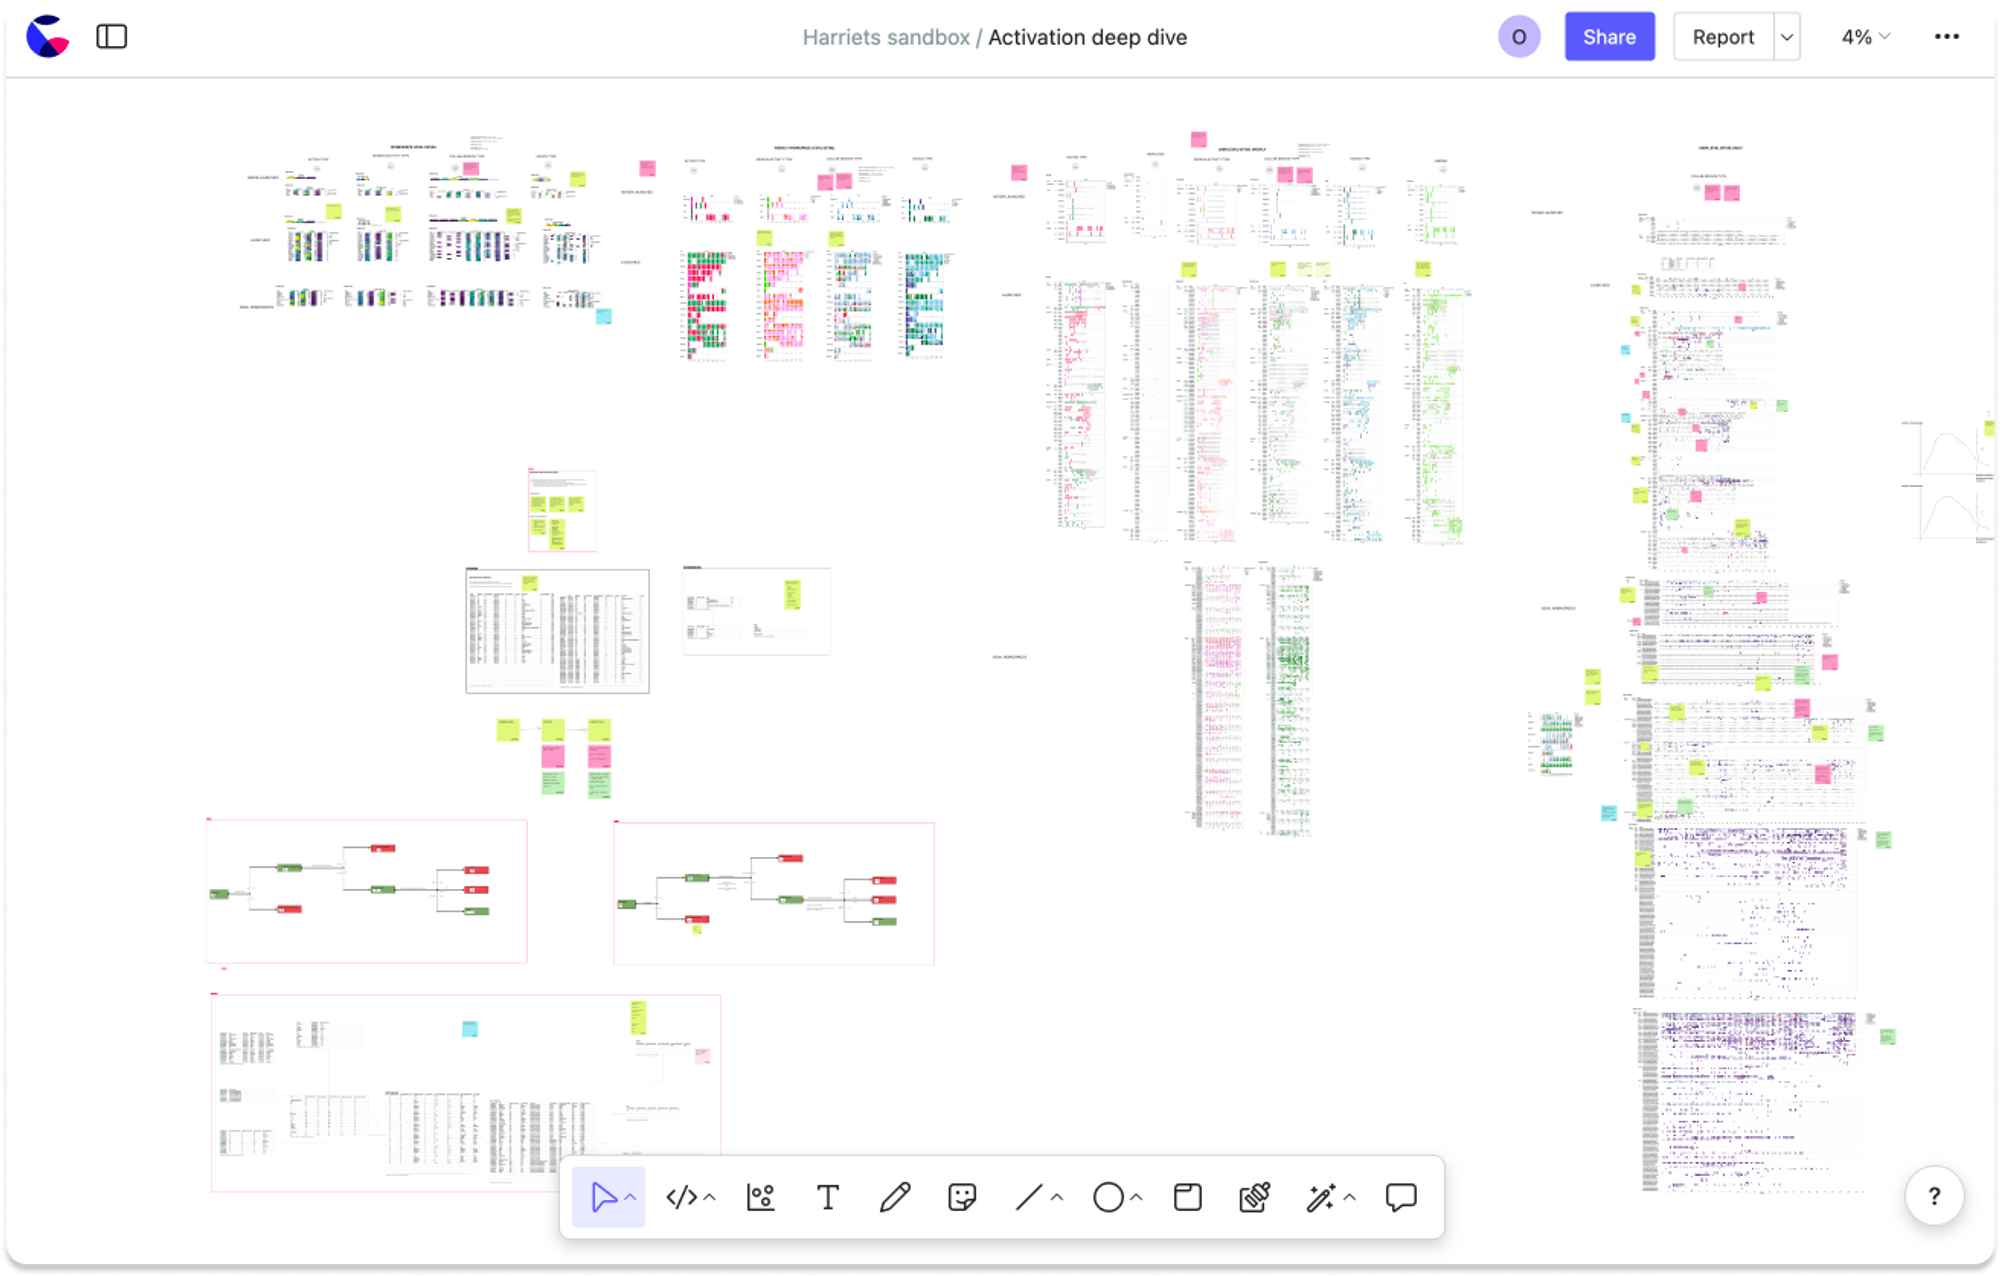
With all the attention it’s been getting lately, chances are you’ve heard a thing or two about DuckDB. Last month we dove in for ourselves and integrated DuckDB into the canvas. We can now confidently say DuckDB deserves every bit of hype you’ve been hearing. This integration has afforded us the opportunity to step back and explain for the first time how the canvas actually works, and why DuckDB takes our browser-first query model to new heights.
Want to skip ahead to experiencing DuckDB in the canvas for yourself? Check out the DuckDB <> Count playground here.
Background
When we started building the canvas two years ago, we knew we had to think carefully about our query architecture. Most data tools at the time were designed for one user to look at one query or visual at a time. The power of the canvas rested in its ability to flex far beyond those bounds. In particular, we knew the canvas had to:
- Let you explore at the speed of thought: the longer you wait for a query to load the fewer you’ll write, and the less exploration you’ll do.
- Scale to lots of users and lots of queries. It’s an infinite canvas, so it is at its best when the whole team is in there together wrestling around a problem using potentially hundreds of queries at the same time.
- Bring out the best of your data. Whether you’re working with large normalized tables in a data warehouse, small CSV files, or somewhere in between, the canvas needed to work efficiently and not bog down your database with unwanted or excessive queries.
- Be deeply collaborative. We wanted to think beyond just comments or version control. We wanted every interaction to be viewable by everyone else - even something as simple as scrolling through a results table.
Now we just had to figure out how to make all that possible.

The VM approach
The standard approach at the time, and still today, is to use virtual machines (VMs) to manage and execute queries. In this setup, a typical interaction might go something like this:
- you submit a query in the browser
- the query is passed to the VM
- the query is passed to the database
- the database evaluates the query
- the database packages and returns the data to the VM
- the VM packages the results and displays them back in the browser
This model is not inherently flawed, but when considering the experience we outlined above, it fell short in a few critical ways:
Too much latency
The latency found in sending queries and results across multiple environments slows everything down. Furthermore, we knew the longer a query took to evaluate, the fewer queries someone would create, ultimately leading to less exploration - a real problem for a data exploration tool.
Scalability challenges
That latency problem only gets worse when you think about scaling across many queries and many users.
Furthermore, VMs have a hard time with large tables and are overkill for small analytical data, which makes up a large percentage of the data that teams actually work with.
Security
When we talked to our users about a VM solution, many were hesitant. Transferring data via VMs can be very secure, but the idea of having many replicas of their data pinging across the globe made them nervous.
It was clear we needed a different approach.
Count’s browser-first architecture
Your computer is fast, and your browser is a heavily optimized environment that is actually very good at crunching data. Why should it be relegated to a dumb terminal that just displays your query results, when it could instead be performing the queries by itself? This ‘fat client’ approach has been picking up steam recently, and we have been particularly inspired by Square’s Crossfilter project and Observable’s JavaScript notebooks.
A browser-first architecture has a few advantages for the canvas:
- no latency: queries can be completed in the time it takes your display to refresh - effectively instantaneously
- handles large enough datasets: the prevailing wisdom suggests that most of the time we don’t need more than a few GB of memory to do analytics, and when we do, we should use our data warehouses for that. Modern browsers can easily scale to analyze GB tables.
- trivial scaling with users: more users = more CPUs to run queries (which is what they really like to do).
- fewer synchronization challenges: when running queries on your database, the results must be synchronized in real-time to everyone viewing the same canvas. When queries are running in your browser, this requirement disappears.
So for a while now, Count has shipped with SQLite to run some queries in-browser, typically when the user isn’t directly writing SQL (for example, when creating visuals).
And it paid off! Even before DuckDB, this approach enabled us to build a performant canvas that could handle up to 690 cells (not a maximum, just the most cells anyone has ever put into a canvas) and up to hundreds of viewers.
But we knew we could do more. For one, this approach only allowed us to run some types of queries locally - and that was still only for those that were small enough for SQLite to handle. For many others, we still had to run those on your database. We were convinced of the power of a browser-first approach but needed help to take it to the next level.
Enter DuckDB.
What's DuckDB?
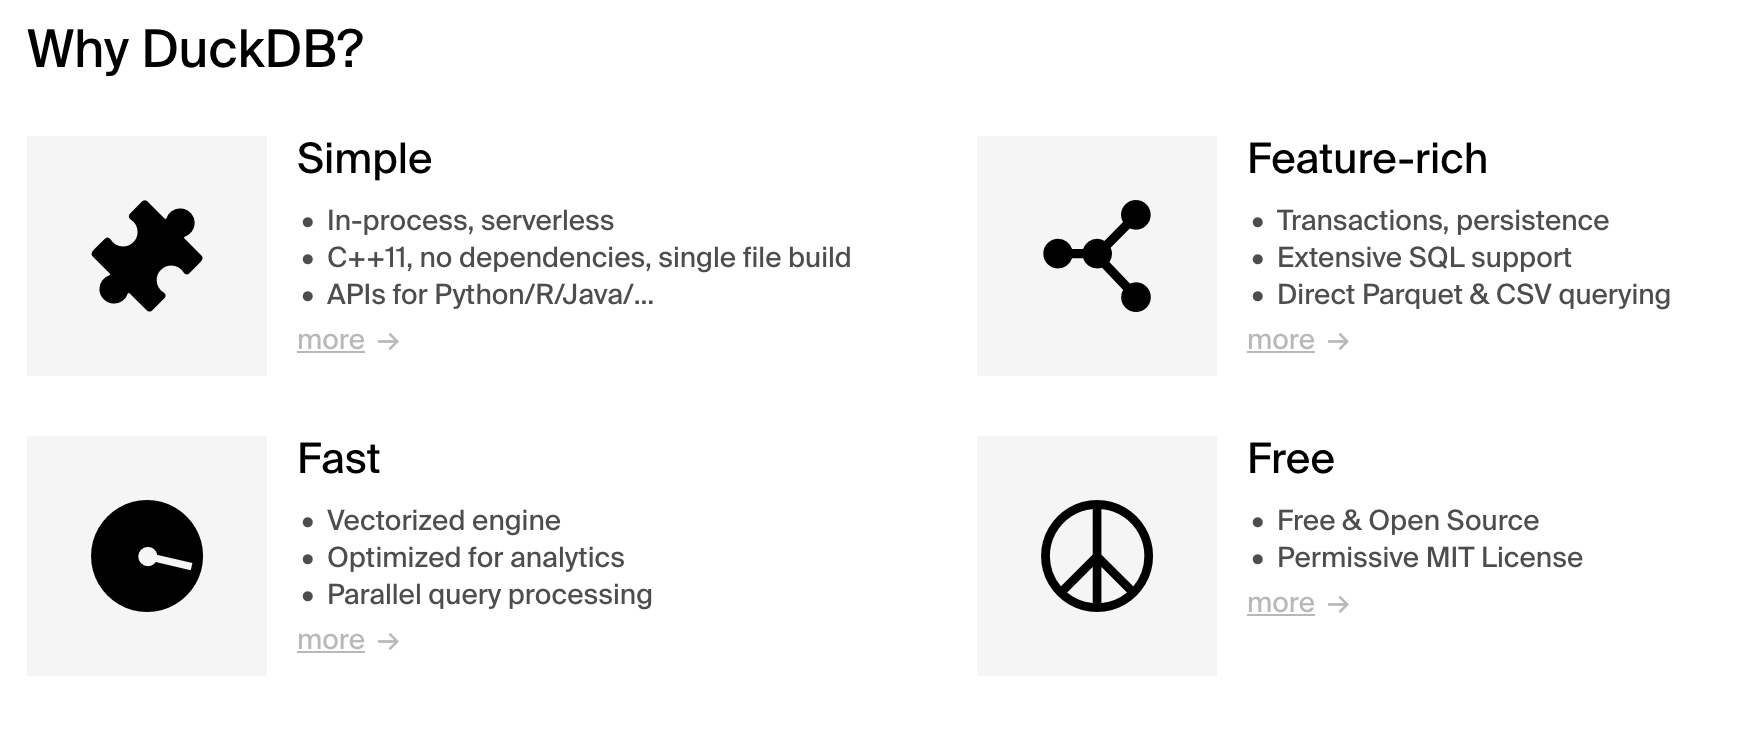
DuckDB is an in-process analytical database that's feature-rich and blazing fast. It’s SQLite for analytics, designed to deliver extremely high performance for analytical workloads without the cost or complexity of a data warehouse.
Like us, DuckDB creators were frustrated with latency and inefficient management of query workloads. They sought to create a database you could run locally, that was optimized for analytics, and that anyone could easily spin up when and where they needed it.

DuckDB is available in many environments, but for the browser, we needed DuckDB-WASM, a WebAssembly-compiled version of DuckDB that can still efficiently read and query Arrow, Parquet, CSV, and JSON files.
DuckDB + Count: a complete in-browser analytical experience
When we added DuckDB into the canvas we went beyond just replacing our SQLite-driven visuals. Using DuckDB-WASM, we made it possible to run any cell - whether that’s a SQL cell, control cell, or visual - on your source database, or in your browser using DuckDB.

So what’s the big deal?
What does this new architecture actually let us do that we couldn’t before?
1. Much faster queries
Not only is DuckDB optimized for analytical queries, but in the canvas, you have the added time-saving found by eliminating latency entirely. Basically, DuckDB queries are quick.
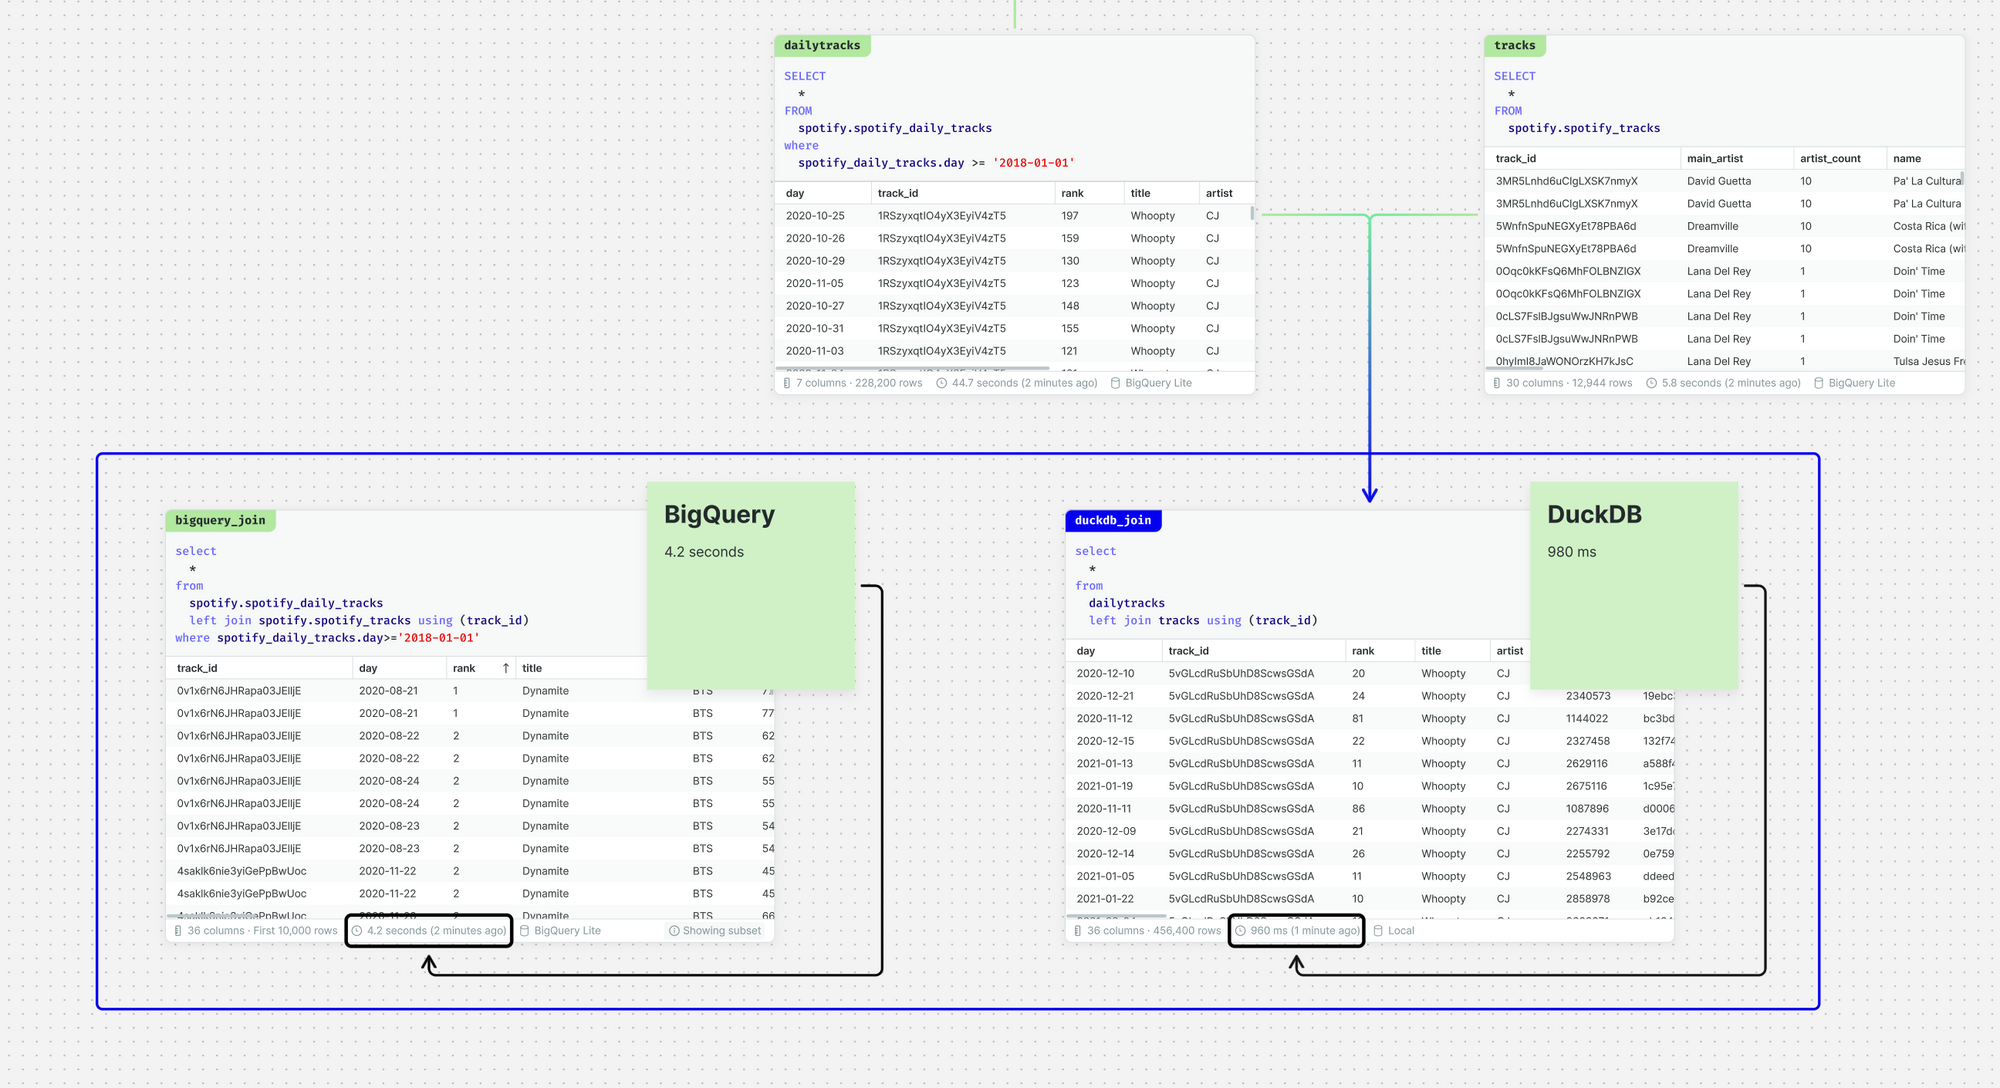
The following screenshot compares the same query run in BigQuery (4.2 seconds) vs DuckDB (980 ms) - and that’s just for a simple join.

We’re edging ever closer to our goal of ‘querying at the speed of thought’.
2. Large-scale, fully interactive visuals, instantly
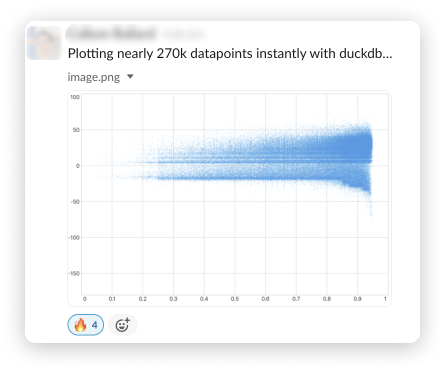
DuckDB + hardware-accelerated visuals means that Count can get results onto your screen in an impressively short time. The target, as always, is faster than a display refresh cycle.

3. Merge any data source
DuckDB also acts as the common ground between any data you have in the canvas. That means you can use it to merge together a CSV file, Google Sheets, and a Snowflake database table.
Under the hood, Count has also switched to storing query result data in the Arrow format which is the native format used by DuckDB. There are many additional benefits to this, including reduced memory usage, higher memory limits, and faster data processing.

4. Reduce your database load
It might seem obvious, but the more queries you run locally in your browser, the fewer you run against your database. Your DBA will thank you, and your IT department might be more amenable to that new laptop you’ve been eyeing with the bigger CPU.
How to try it for yourself
You’ll find no shortage of articles benchmarking the performance of DuckDB, but in our opinion, the charts and tables don’t really do it justice. The best way is to experience it for yourself.
To do that, you can create a local cell in any of your canvases, or explore the DuckDB playground here.
This was not a sponsored post :)
